Build a Modern Scalable System - Practice on Embedded Router Mode w/ Spring-Cloud
Published:
by
Zhenghui Lee
![]()
- Categories:
- microservices 7
This article is Part 3 in a 7-Part Series.
- Part 1 - Build a Modern Scalable System - Basics
- Part 2 - Build a Modern Scalable System - Runtime Challenges
- Part 3 - This Article
- Part 4 - Build a Modern Scalable System - Practice on Gateway Mode For Mixed-Languages Case
- Part 5 - Build a Modern Scalable System - Practice on Service Mesh Mode with Consul and Nomad
- Part 6 - Build a Modern Scalable System - Practice on Service Mesh Mode with Consul, Nomad and Envoy
- Part 7 - Build a Modern Scalable System - Presentation of Runtime and Data Layers Challenges(in Chinese)
Table of Contents
- Table of Contents
- Recall the embedded router mode
- Landscape of Spring-Cloud in MSA
- PoC sample
- AOP Background
- Event-Driven(Kafka)
- Aggregated Logging(Sidecar Task + Kafka + ELK)
- Circuit Breaker(Hystrix)
- Distributed Tracing(OpenTracing)
- Spring Boot Admin UI
- APIDoc(Swagger)
- Performance Analyzer
- Run sample
- Wrapping up
In last post, I introduced the runtime challenges in MSA, and listed three typical reference modes to resolve communicationconcerns. This post will provide a hands-on architecture PoC(proof-of-concept) sample that introduce the embedded router mode by practice. The sample is aimed to demonstrate how to build and run a microservices architecture(MSA) application with excellent technologies offering by Spring-Cloud, Hashicorp, Elastic, Netflix and etc.
All of the sample source code is hosted on repsoitry, it is automated, and easy to run. Indeed, the sample content is far beyond the MSA, besides the MSA-related features, like service discovery, load balance, api-gateway, circuit breakers, distribiuted tracing , aggregated logging(implemented by the sidecar mechanism by Nomad), I also add more features which we usually be used by application in Java and/or Spring-Cloud, including define a customzied annotation based AOP feature, Event-Driven via kafka(transactional message), flamegraph perf for performance analysis in Java, both IBM and Oracle JDK heap analysis and coredump analysis, etc.
Recall the embedded router mode
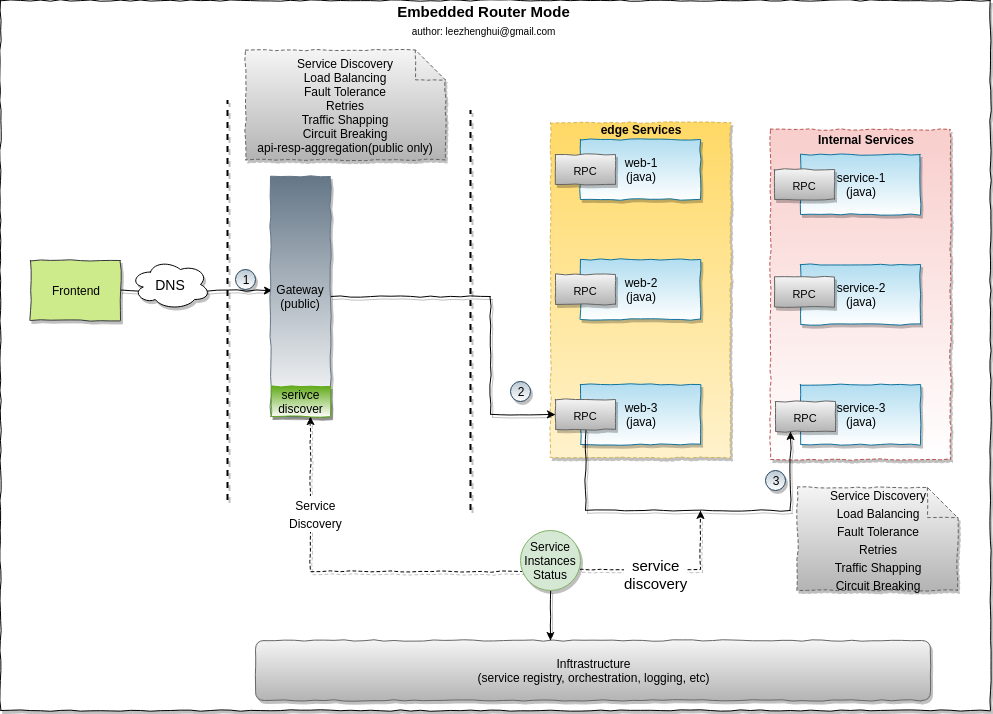
Please refer to my early post reference-modes-for-msa-service-communication for more details about the MSA runtime challenges.
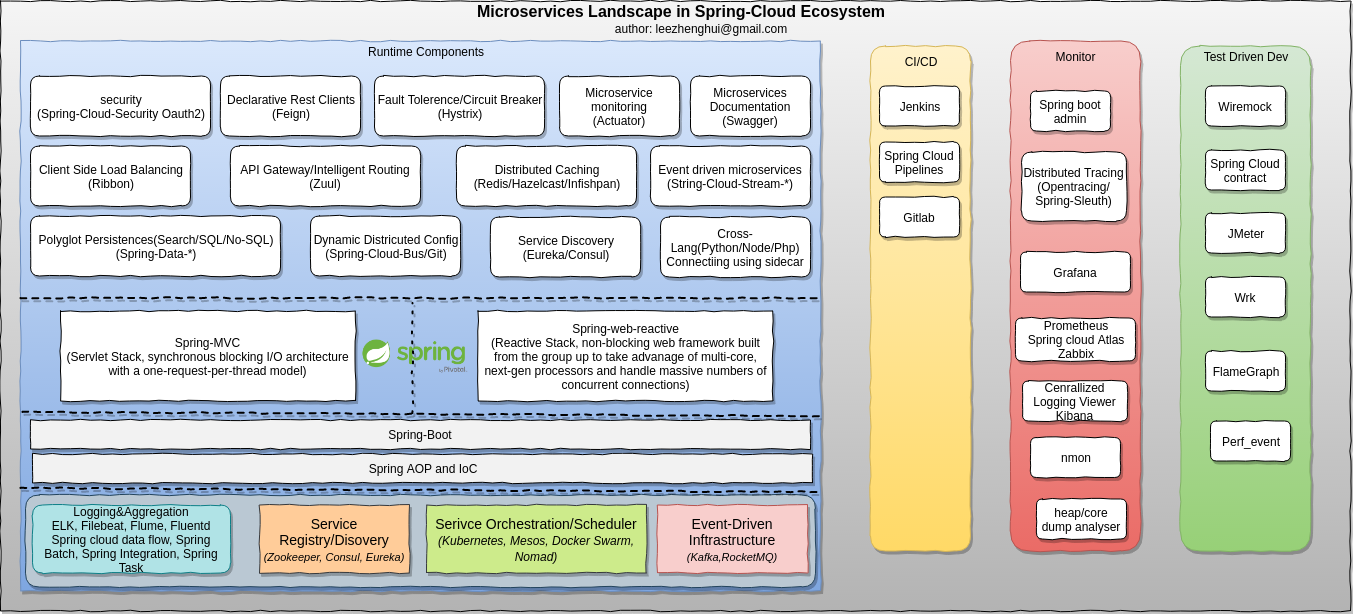
Landscape of Spring-Cloud in MSA
PoC sample
Scenario overview
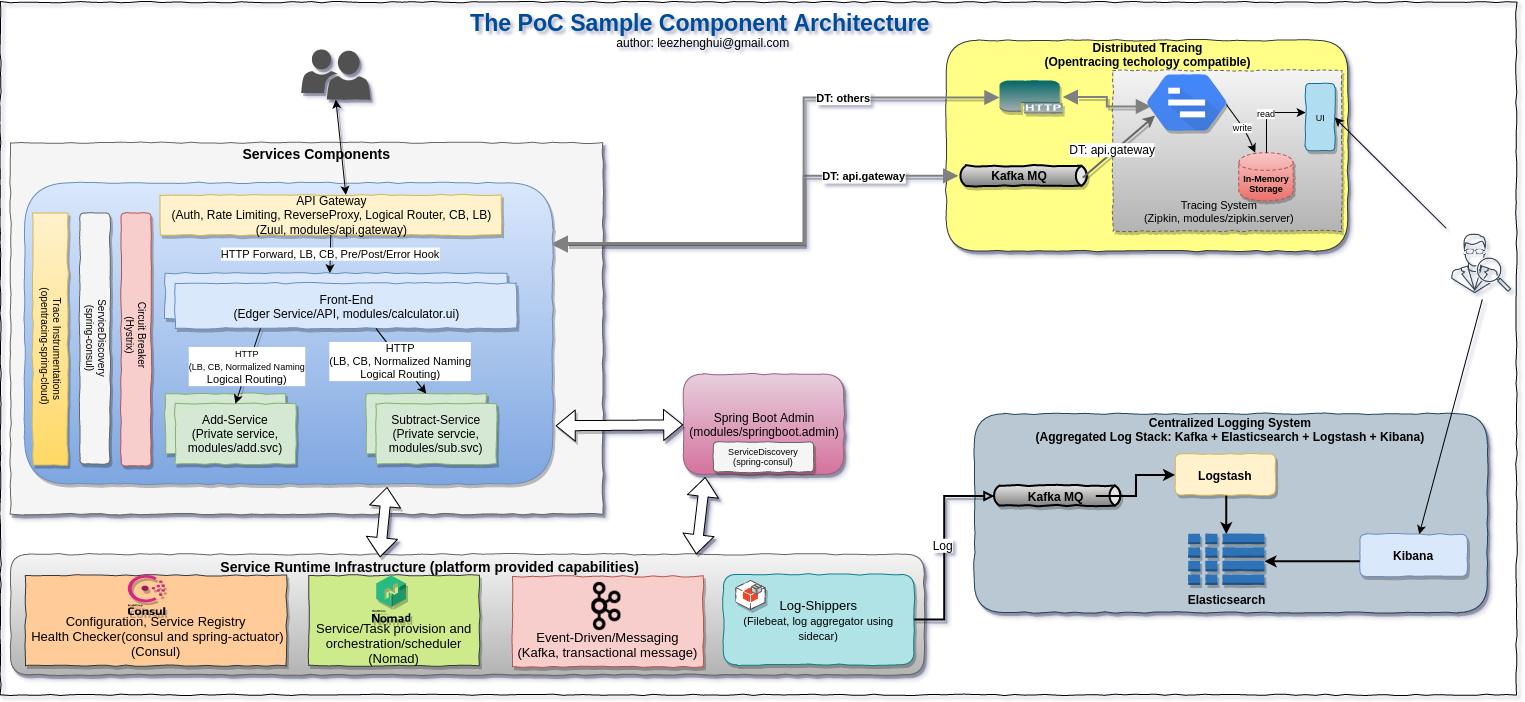
Soruce code structure
Modules
├── modules
│   ├── add.svc               // add operator service, which will be called by calculator-ui
│   │   ├── build.gradle
│   │   ├── out
│   │   └── src
│   ├── api.gateway           // api.gateway based on Zuul
│   │   ├── build.gradle
│   │   ├── out
│   │   └── src
│   ├── calculator.ui         // front-end service(edge service), which will be exposed on public cloud
│   │   ├── build.gradle
│   │   ├── out
│   │   └── src
│   ├── ifw.lib               // A prototype simple library impl to demonstrate an AOP based invocation framework with annotated QoS supports (just for demo only, not a production quality)
│   │   ├── build.gradle
│   │   ├── out
│   │   └── src
│   ├── springboot.admin      // spring-boot admin service
│   │   ├── build.gradle
│   │   ├── out
│   │   └── src
│   ├── sub.svc               // subtract operator service, which will be called by calculator-ui
│   │   ├── build.gradle
│   │   ├── out
│   │   └── src
│   ├── turbine.aggr          // turbine aggregation service
│   │   ├── build.gradle
│   │   ├── out
│   │   └── src
│   └── zipkin.server         // Zipkin server(with HTTP and kafka collectors, in-memory span storage)
│       ├── build.gradle
│       ├── out
│       └── src
Operational source code
ops
├── Vagrantfile   // Vagrant file
├── ansible       // ansible scripts for install and start services, including: commoent runtime dependences, zookeeper, kafka, nginx(for local pkgs repo), install JVM, filebeat, consul, nomad, elasticsearch, logstash, kibana and wrk
├── bin           // script, including boostrap.sh, click.sh(fire an invocation on the sample), kafka-*-monitor.sh, start_all_jobs.sh and stop_all_jobs.sh
├── deployable    // nomad job definition files(hcl) for microservices
├── deps          // binary dependences, which cache it locally to reduce(avoid) network deps during demonstration
├── dist          // pkgs publish folder, nginx is started on this folder to simulate a pkg repository
└── log-shipper   // filebeat conf for log-shipper side-task
The PoC sample covered features matrix:
| MSA Capability | Feature | Tech-Deps/Vendors | Related Module |
|---|---|---|---|
| Dev | APIDoc | Swagger | calculator.ui, add.svc, sub.svc |
| AOP | Spring AOP | ifw.lib(customized aop annotation), calculator.ui | |
| Evn-Spec Config | Spring-profiles | All | |
| Intercommunication | Edge-Servie(API) Gateway | Zuul | api.gateway |
| Service Discovery/Registry | Consul | All | |
| Load Balance | Consul, Spring, Ribbon | api.gateway, calculator.ui | |
| Event-Driven/Messaging | Kafka(transactional message) | ifw.lib(counter interceptor), calculator.ui | |
| Circuit Breakers | Spring, Hystrix | api.gateway, calculator.ui | |
| Distributed Tracing | OpenTracing, Kafka, Zipkin | calculator.ui(HTTP), add.svc(HTTP), sub.svc(HTTP), api.gateway(Kafka), zipkin.server | |
| Service Orchestration | Service Scheduling | Nomad | Hybrid deployables support, standalone, container. |
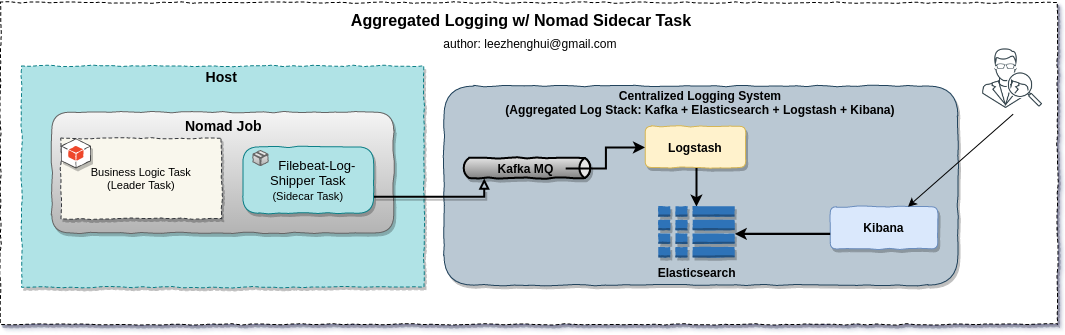
| Aggregated Logging | Nomad(Sidecar Task), Filebeat, Kafka, ELK | calculator.ui(local file), add.svc(local file), sub.svc(local file), api.gateway(Kafka) | |
| Operation | Service Admin | Springboot-Admin, Spring-acutator | All |
| Service allocation status | Nomad, Hashi-ui | All | |
| Distributed Tracing Reporter | Zipkin-ui | All | |
| Aggregated Logging Query | ELK, Kibana | All | |
| Overall System(Linux) profiling | nmon | All | |
| Process full stack(java, c, kernel) profiling | perf_event, framegraph | All | |
| Java heap analysis | IBM JDK | ||
| Java heap analysis | Oracle JDK | ||
| Java thread(coredump) analysis | IBM JDK | ||
| Java thread(coredump) analysis | Oracle JDK | ||
| Web Perf Testing | wrk |
Notable:
CI/CD refer to the combined practices of
continuous integrationandcontinuous deliveryIn order to keep the PoC sample as simple as possible, I am using a simple script to simulate CI/CD features here.
AOP Background
Proxy pattern
The proxy is a well-used design pattern. We can see it in either high level software architecture design, e.g: api-gateway and service mesh in microservices, or a narrow-down specific programming module. Generally speaking, the proxy pattern provides the capablity to implement a contract interface, but adds special functionality on-the-fly behind the sense.
Aspect Oriented Programming(AOP) addresses the problem of cross-cutting concerns. It is a complement to Object-Oriented-Programming(OOP). Not like OOP, which provide class as an key unit of modularity, AOP focus on aspect as it's unit of modularity, the aspect extract and modularization the code which cut across multiple classes/components for the same concern solution in a system. Such concerns are often termed cross-cutting concerns in AOP literature. In a real-life system, the typical cross-cutting concerns includes logging, security, transaction management, caching, validation, etc. Providing AOP capability is important to increase modularity, and normally be a fundamental feature in a middleware platform.
AOP in Java
AOP is really popular in java. In a JEE runtime, the transaction, security are noramlly provided as AOP aspects under the hood. In SOA, the SCA runtime also heavily depends on the AOP to provide QoS, IT-Specific features around the business logic. In Spring, the AOP is actually delivered as a base component in fundamental layer and open to upper stack. Indeed, per my experiences on JEE server development, AOP provides an excellent solution for the problems in enterprise application field to increase modularity and make the system more loose-coupled, especially in the middleware product development.
Implementing an AOP framework to advise method execution, the proxy pattern is perfect fit here. The aspect module code can be abstracted, prepared and injected at before and after points of the method and also be able to recieve the execution context, arguments and output(or fault) to the target operation like it was there. That is reason we usually see the proxy pattern in an AOP framework. In a pure java world, some typical approaches to achieve this:
- Weave(static-way)
- Compile-time weaving(e.g: using AspectJ compiler, which can provide complete AOP implementation)
- Load-time weaving(e.g: AspectJ LTW, which depends on the JVM option -javaagent, provide complete AOP implementation)
- JDK Proxy(dynamical-way, for java interface and method execution join point only)
- CGlib Proxy(dynamical-way, adopt to both class and interface, method execution join point only, but need the proxied method to be public)
In a pure java world, using dynamical proxy way for AOP implementation, it usually be used in conjunction with a IoC container, which can take over the responsibility of proxy instance construction and injection. Hide these implementation details and provide a clean/easy-to-use programming model to developer.

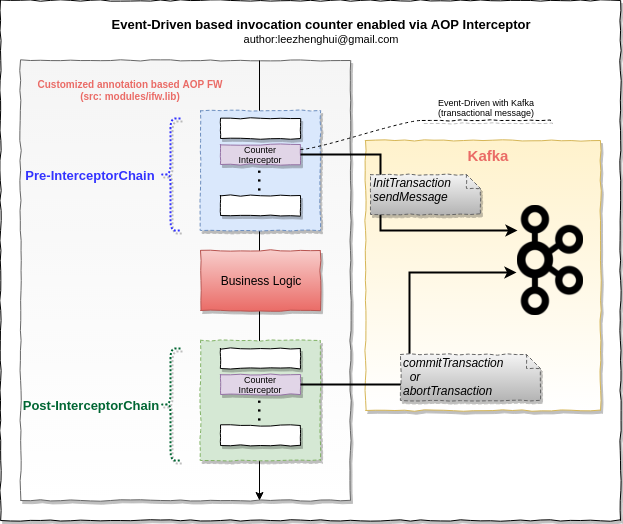
Event-Driven(Kafka)
From Christian Posta
Event-driven is a very important approach to decopule the data model among servcies and keep data consistency in a eventaully consistency fashion. I also demonstrate it in this sample via Kafka transactional message. This demon feature is delivered by a customzied annotation based AOP interceptor, you can find both simple AOP-Framework and the interceptor in "modules/ifw.lib"
Aggregated Logging(Sidecar Task + Kafka + ELK)
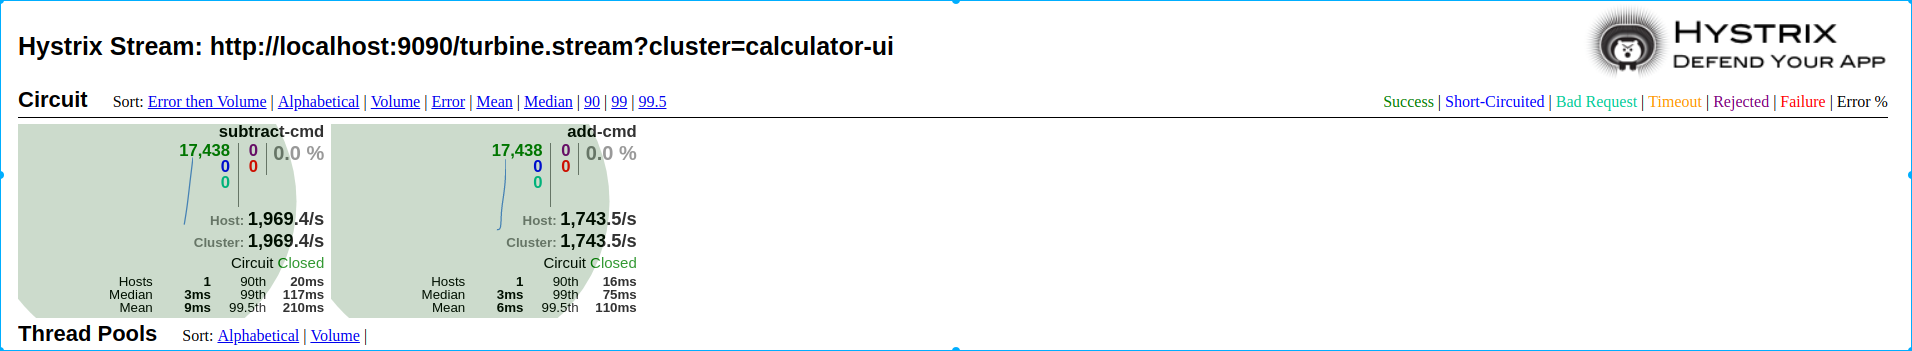
Circuit Breaker(Hystrix)
Scenario
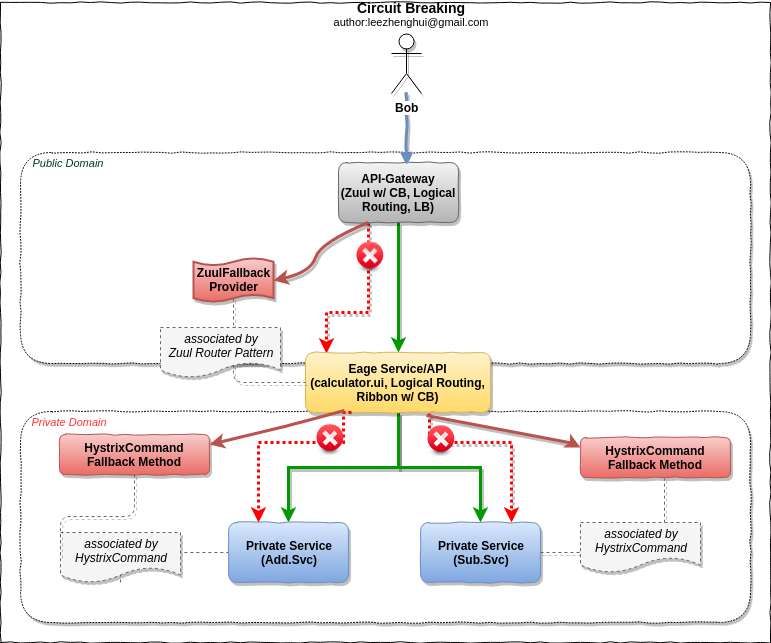
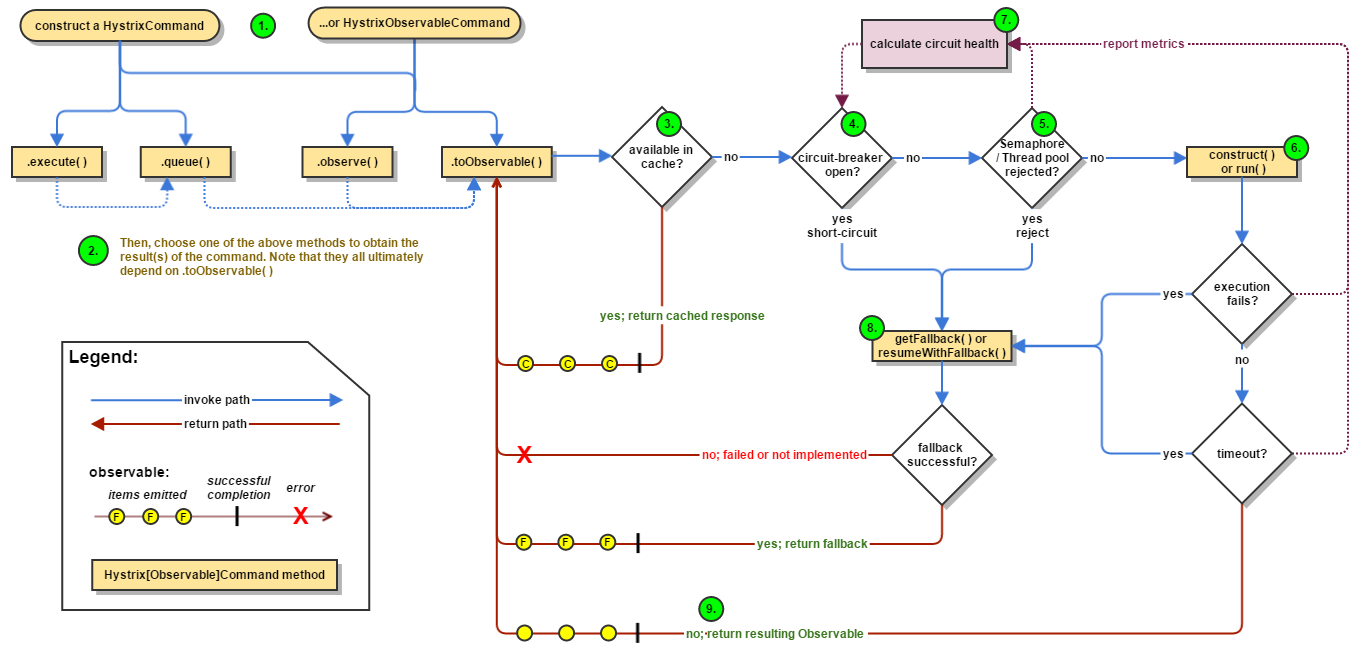
Hystrix
Please refer to Hystrix for more details about how Hystrix works.
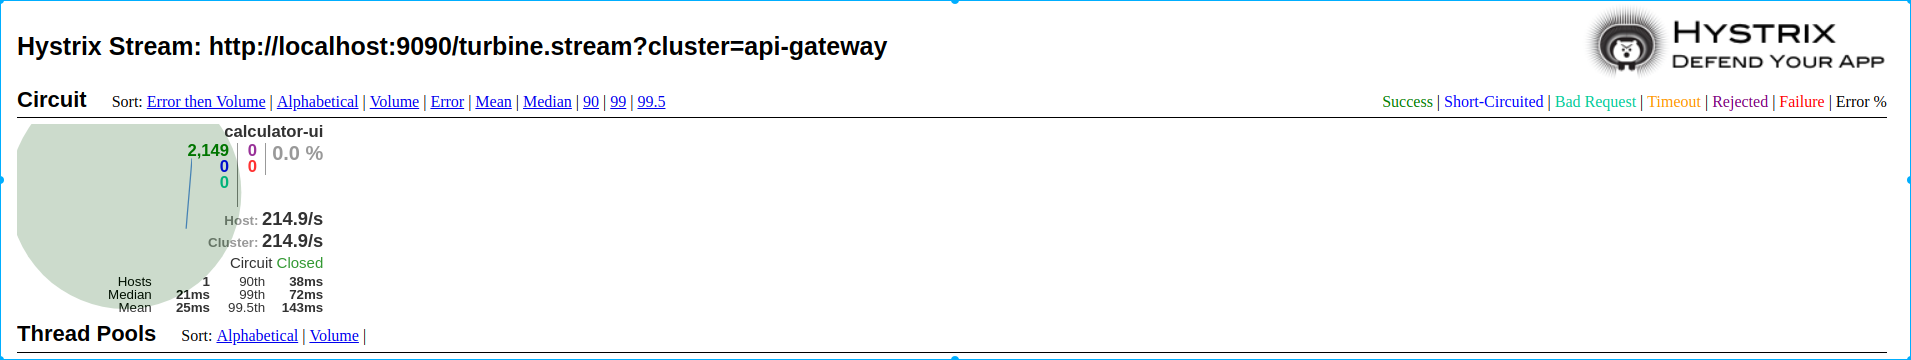
Turbine Aggregation
  - Open browser and input url  http://localhost:9090/hystrix
  - Input dashboard stream url as below:
    [1] http://localhost:9090/turbine.stream?cluster=api-gateway
    [2] http://localhost:9090/turbine.stream?cluster=calculator-ui
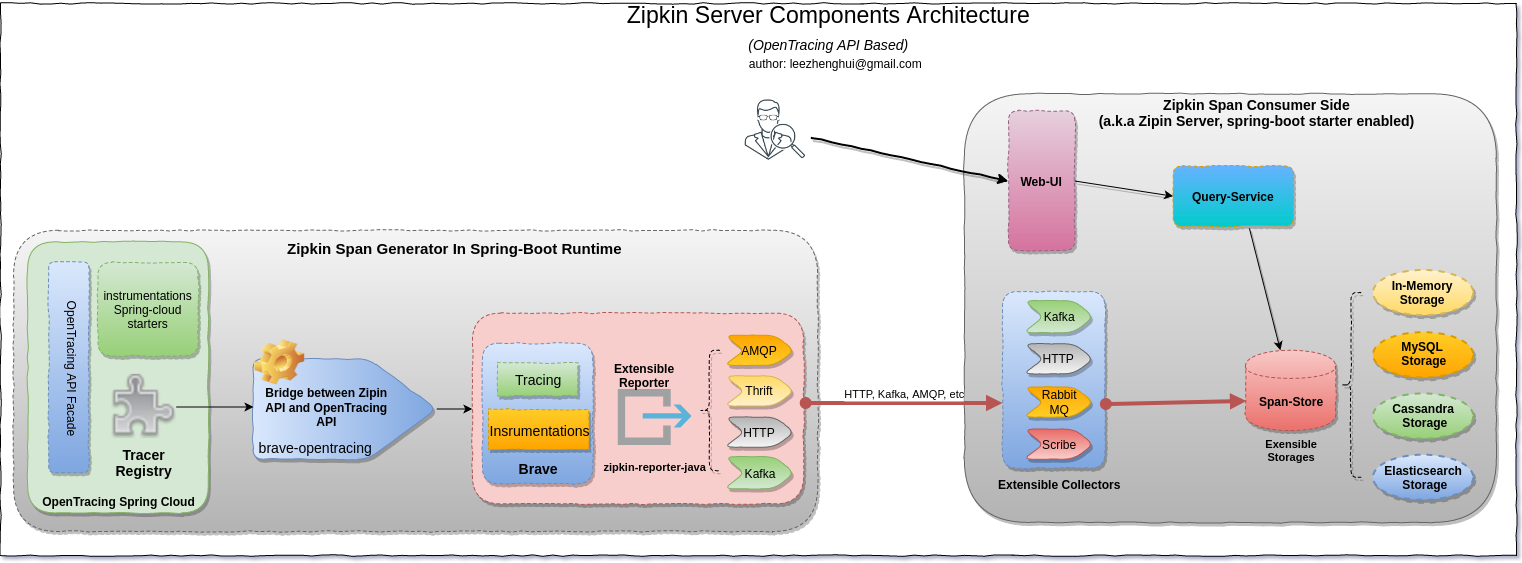
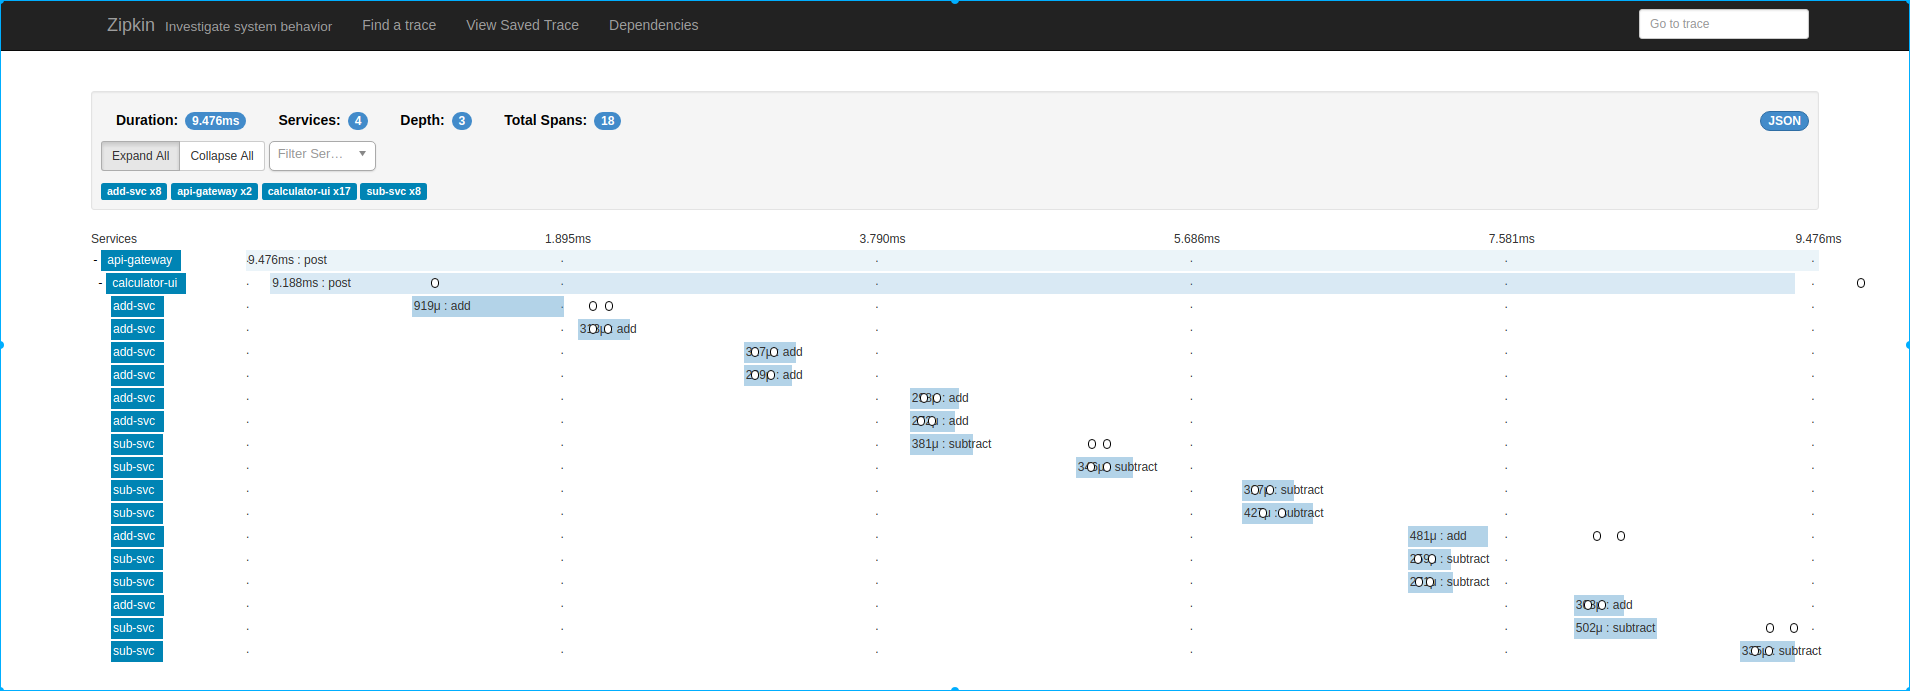
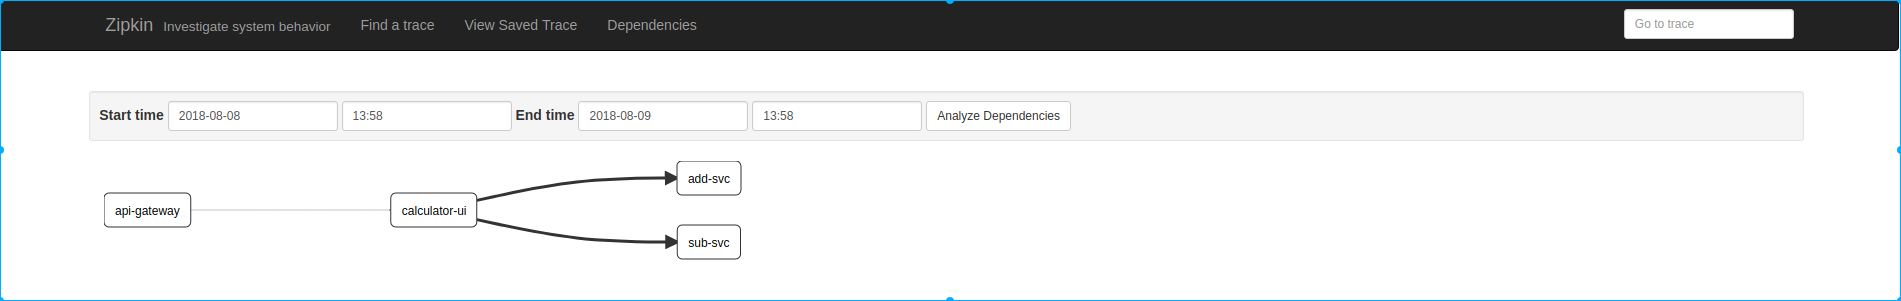
Distributed Tracing(OpenTracing)
Microservices architecture faces certain challenges that are not common for monolithic systems – one of them is traceability of end-to-end transaction that is executed in distributed environment and that can potentially involve invocation of large number of diverse applications and services. In case of performance degradation or fatal exception thrown that is experienced in end-to-end solution, identication of bottleneck component/failure point become more and more diffcult. Distributed tracking is used to resolve the problems in this area.
The default option for spring-cloud is using
spring-cloud-sleuthfor this feature, but I want to show you withopentracingto adopt to a mixed-languages situation. So, in this PoC sample, I'm usingopentracing-spring-cloudinstead ofspring-cloud-sleuth, as it will bring us more benifits for cross porgramming languages environment, as well the switching from Zipkin to others, e.g: Jaeger.
opentracing-spring-cloud contains auto-configurations which can be enabled to instruments and trace following Spring Boot projects:
- Spring Web (RestControllers, RestTemplates, WebAsyncTask)
- @Async, @Scheduled, Executors
- WebSocket STOMP
- Feign, HystrixFeign
- Hystrix
- JMS
- JDBC
- Mongo
- Zuul
- RxJava
- Standard logging - logs are added to active span
- Spring Messaging - trace messages being sent through Messaging Channels
- RabbitMQ
Zipkin
Components Architecture (includes both span generator side and consumer side)
Workflow
Below is the description from zipkin architecture doc
Here's an example sequence of http tracing where user code calls the resource /foo. This results in a single span, sent asynchronously to Zipkin after user code receives the http response.
┌─────────────┐ ┌───────────────────────┐  ┌─────────────┐  ┌──────────────────┐
│ User Code   │ │ Trace Instrumentation │  │ Http Client │  │ Zipkin Collector │
└─────────────┘ └───────────────────────┘  └─────────────┘  └──────────────────┘
       │                 │                         │                 │
           ┌─────────┐
       │ ──┤GET /foo ├─▶ │ ────┐                   │                 │
           └─────────┘         │ record tags
       │                 │ ◀───┘                   │                 │
                           ────┐
       │                 │     │ add trace headers │                 │
                           ◀───┘
       │                 │ ────┐                   │                 │
                               │ record timestamp
       │                 │ ◀───┘                   │                 │
                             ┌─────────────────┐
       │                 │ ──┤GET /foo         ├─▶ │                 │
                             │X-B3-TraceId: aa │     ────┐
       │                 │   │X-B3-SpanId: 6b  │   │     │           │
                             └─────────────────┘         │ invoke
       │                 │                         │     │ request   │
                                                         │
       │                 │                         │     │           │
                                 ┌────────┐          ◀───┘
       │                 │ ◀─────┤200 OK  ├─────── │                 │
                           ────┐ └────────┘
       │                 │     │ record duration   │                 │
            ┌────────┐     ◀───┘
       │ ◀──┤200 OK  ├── │                         │                 │
            └────────┘       ┌────────────────────────────────┐
       │                 │ ──┤ asynchronously report span     ├────▶ │
                             │                                │
                             │{                               │
                             │  "traceId": "aa",              │
                             │  "id": "6b",                   │
                             │  "name": "get",                │
                             │  "timestamp": 1483945573944000,│
                             │  "duration": 386000,           │
                             │  "annotations": [              │
                             │--snip--                        │
                             └────────────────────────────────┘
Trace instrumentation report spans asynchronously to prevent delays or failures relating to the tracing system from delaying or breaking user code.
Zipkin-UI
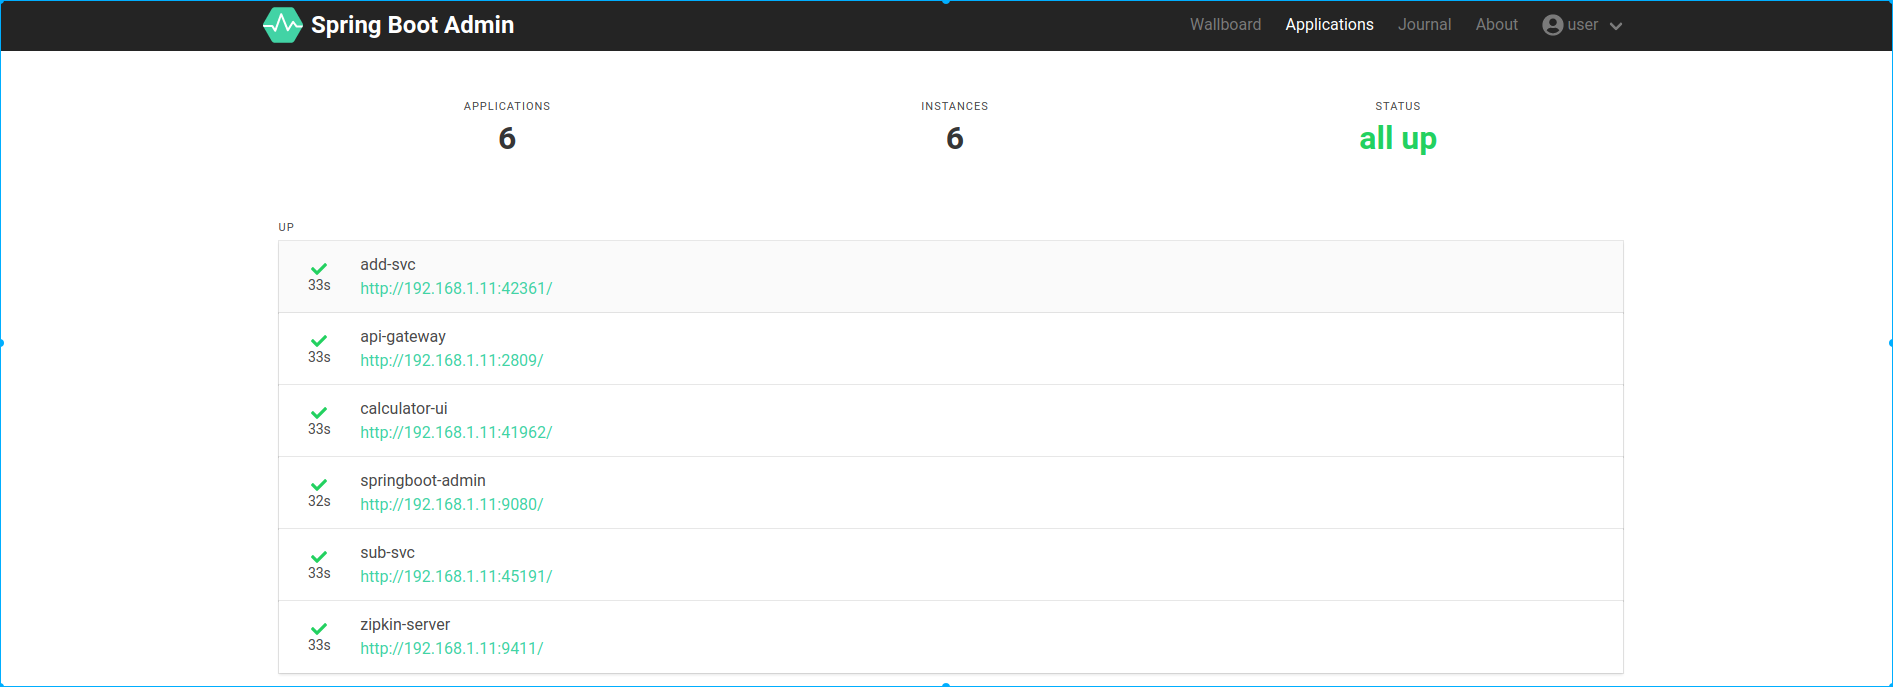
Spring Boot Admin UI
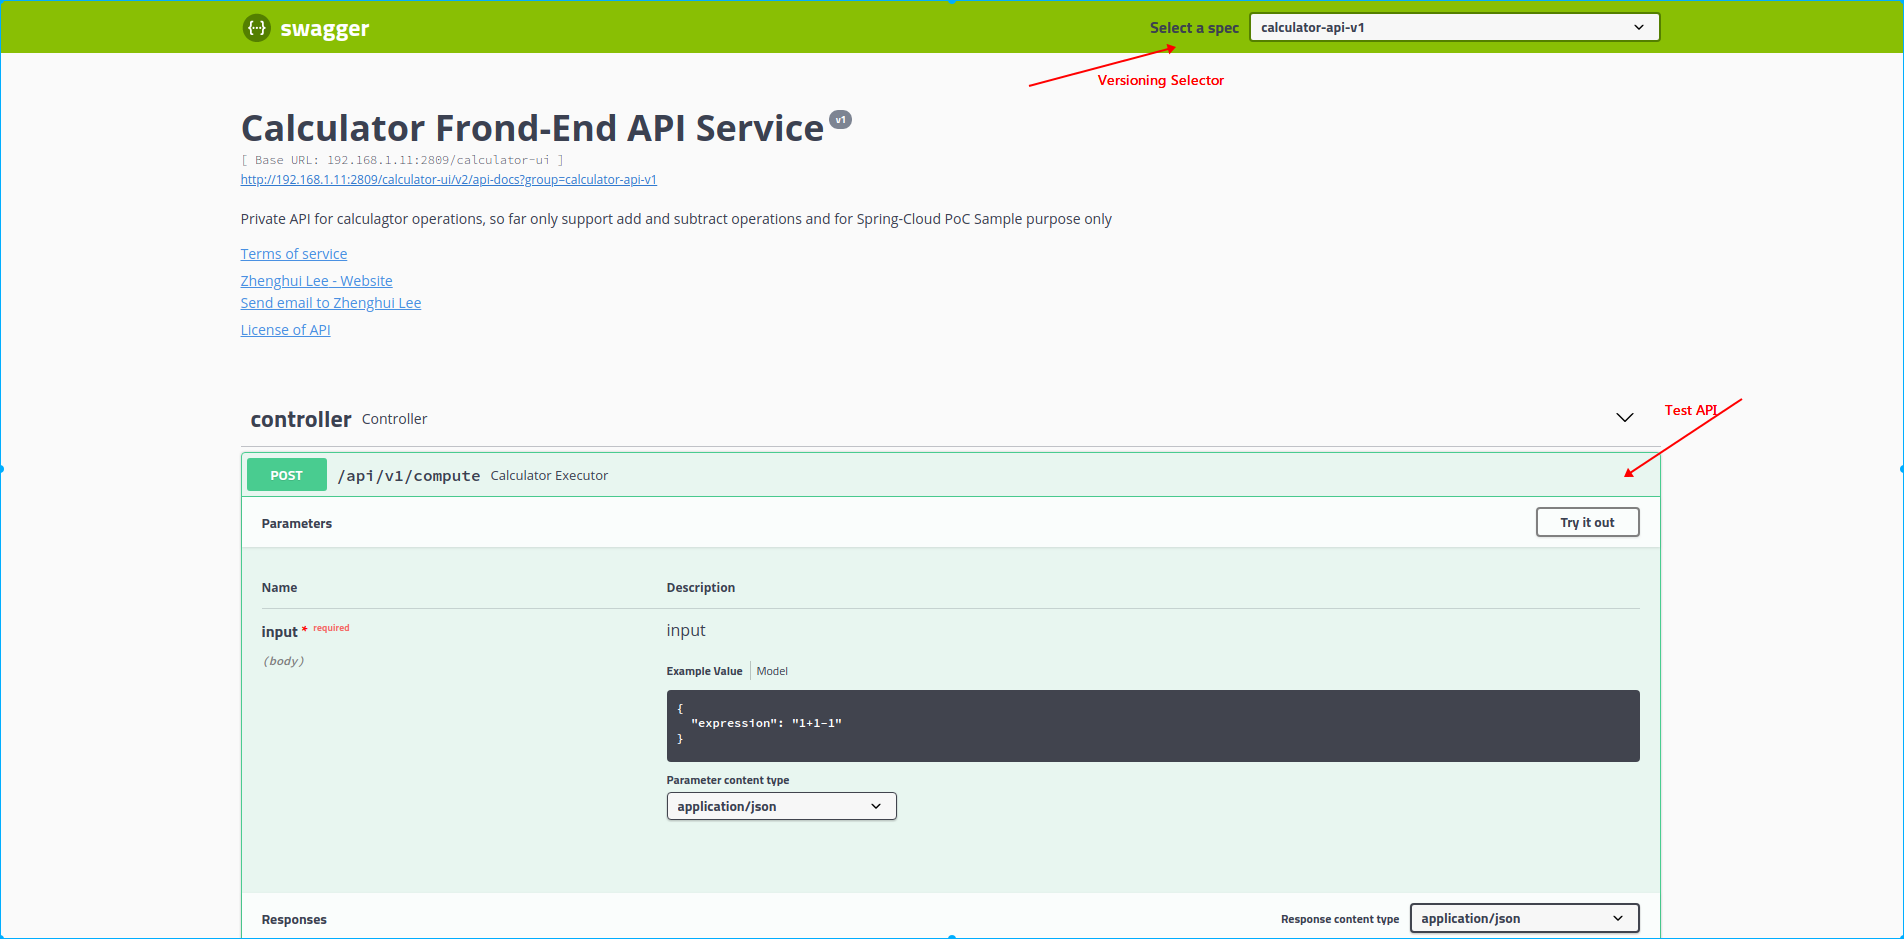
APIDoc(Swagger)
In Spring-Cloud, the RESTful API actually play the key role in the ecosystem. Why/How do we document our RESTful API?
Why
The most important design principle for RESTful Services is Think about consumer of the API, Not like SOAP-Based Web service, REST does not provide a spec or a contract like WSDL in SOAP. Indeed, REST gives you the flexibility to choose proper documentation format and approach. But that does not mean “No documentation”. We do need to document our API.
How
-
Poor man's option is to maintain documentation manually. But that gets you to much boring work for the doc to sync up with the latest code, and also versioning work.
-
An Other option is to generate documentation from code. Spring-Cloud provides an easy way to do this. The PoC
There are multiple approaches to documenting your RESTful API
- [WADL](https://javaee.github.io/wadl/)
- RESTDocs
- Swagger or OpenDocs
Swagger appears in the last couple of years and is now the most popular REST API documentation standard. We will use it in our sample for APIDoc generation
Generating Swagger Document
To generate swagger document, springfox currently provides a popular solution in spring-boot. We just need to introduce the dependence to springfox-swagger2, configure the Docket, using the appropriate annotations on the API router, method and models, then the swagger document will be generated automatically.
Access it via:
http://<hostname>:<port>/v2/api-docs
If we want a visual UI and execute the API with test request, just add a dependence to springfox-swagger-ui. and open below link in browser:
http://<hostname>:<port>/swagger-ui.html
Performance Analyzer
System profiling - nmon
Use nmon to collect the basic system profiling data. When do the benchmark testing, run the nmon command in background for overall system profiling, below is an example of visualized performance analysis result(charts in spreadsheet) translated from nmon profiling data: hello-springcloud_180918_0439.nmon.xlsx
FlameGraph with Perf_Event (Linux only)
Prerequisites
-
Have perf_event tool installed on your linux environment
# On Ubuntu
  sudo apt-get install -y linux-tools-common
The sample was verified on ubuntu with kernel below:
Linux lizh-laptop 4.4.0-72-generic #93~14.04.1-Ubuntu SMP Fri Mar 31 15:05:15 UTC 2017 x86_64 x86_64 x86_64 GNU/Linux
- Using JDKv8(>=v8u60) or JDKv9 to support
-XX:+PreserveFramePointer$ java -version java version "1.8.0_60" Java(TM) SE Runtime Environment (build 1.8.0_60-b27) Java HotSpot(TM) 64-Bit Server VM (build 25.60-b23, mixed mode) - Set JAVA_HOME properly
export JAVA_HOME=<YOUR_JDK_HOME> -
Install perf-map-agent
perf-map-agentis the instrument tool to translate theJava Symbolsforperf_event, that means perf_event will read the map to unerstand theVMA(Virutal Memory Address) to corresponding Java symbols, and generate a human readble reportsudo apt-get install -y cmake git clone https://github.com/jrudolph/perf-map-agent cd perf-map-agent cmake . makeattach-main.jarandlibperfmap.soget compiled in the out folder - Create command links in
<HOME>/bincd <perf-map-agent_HOME>/bin ./create-links-in <HOME>/binA soft link for
perf-java-flamescommand will be created in<HOME>/bin, so we can use this command anywhere without the need of full path specified. - Install FlameGraph
  git clone https://github.com/brendangregg/FlameGraph
  export FLAMEGRAPH_DIR=<FlameGraph_HOME>
Profiling Java(on-cpu-sampling)
- Run Java process with
-XX:+PreserveFramePointer, e.g:cd <modules>/calculator.ui java -XX:+PreserveFramePointer -jar ./out/libs/calculator.ui-1.0.0.jar - Check it is enabled(on Linux)
ps wwp `pgrep -n java` | grep PreserveFramePointer - Profiling and generate flamegraph for the Java process
perf-java-flames <pid> - Sample result

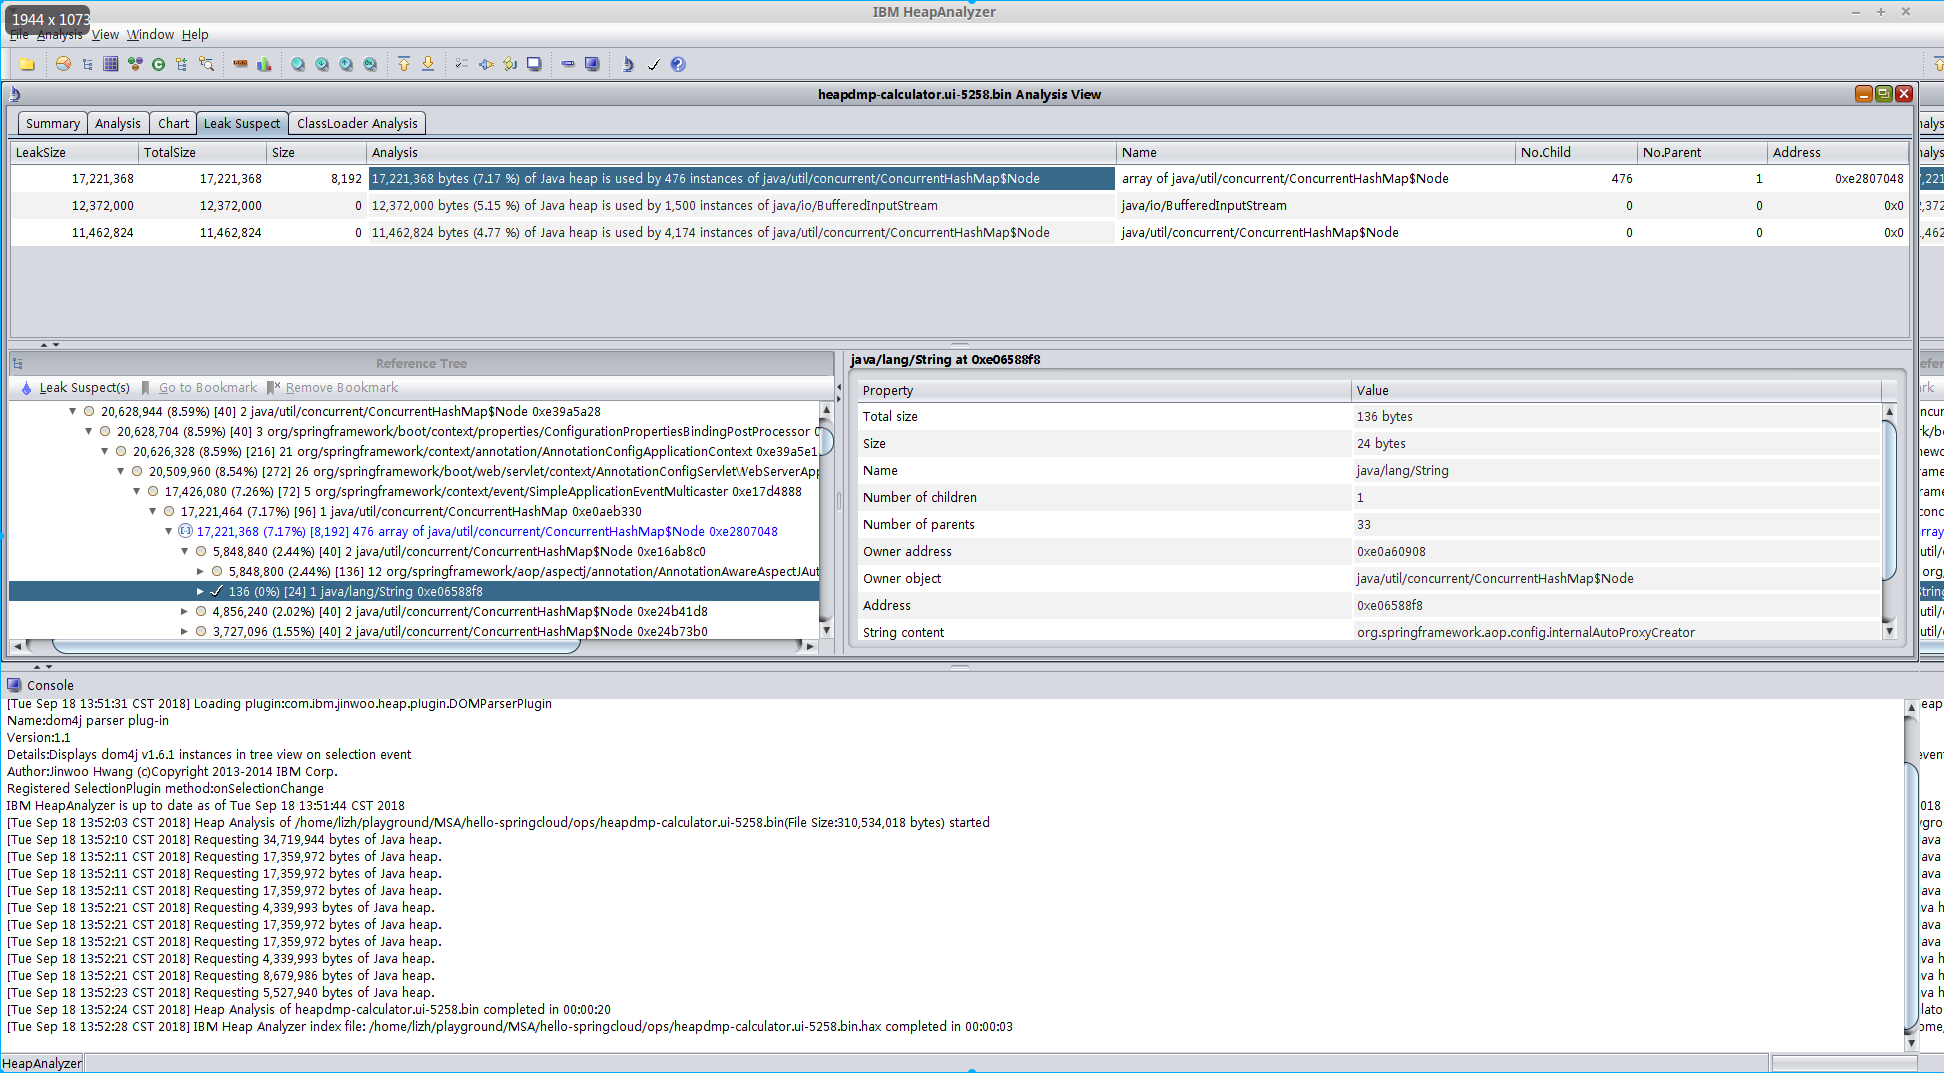
Heap Analysis
-
Oracle JVM Tools:
jmapand ibm-heap-analyzer- Steps:
-
Generate a heap dump for a java process(e.g: pid 5258)
jmap -dump:format=b,file=./heapdmp-calculator.ui-5258.bin 5258 -
Open the heap dump file(
heapdmp-calculator.ui-5258.bin) withibm-heap-analyzercd <ibm-ha_home> java -Xmx4g -jar ha456.jar
-
- Result:
- Steps:
-
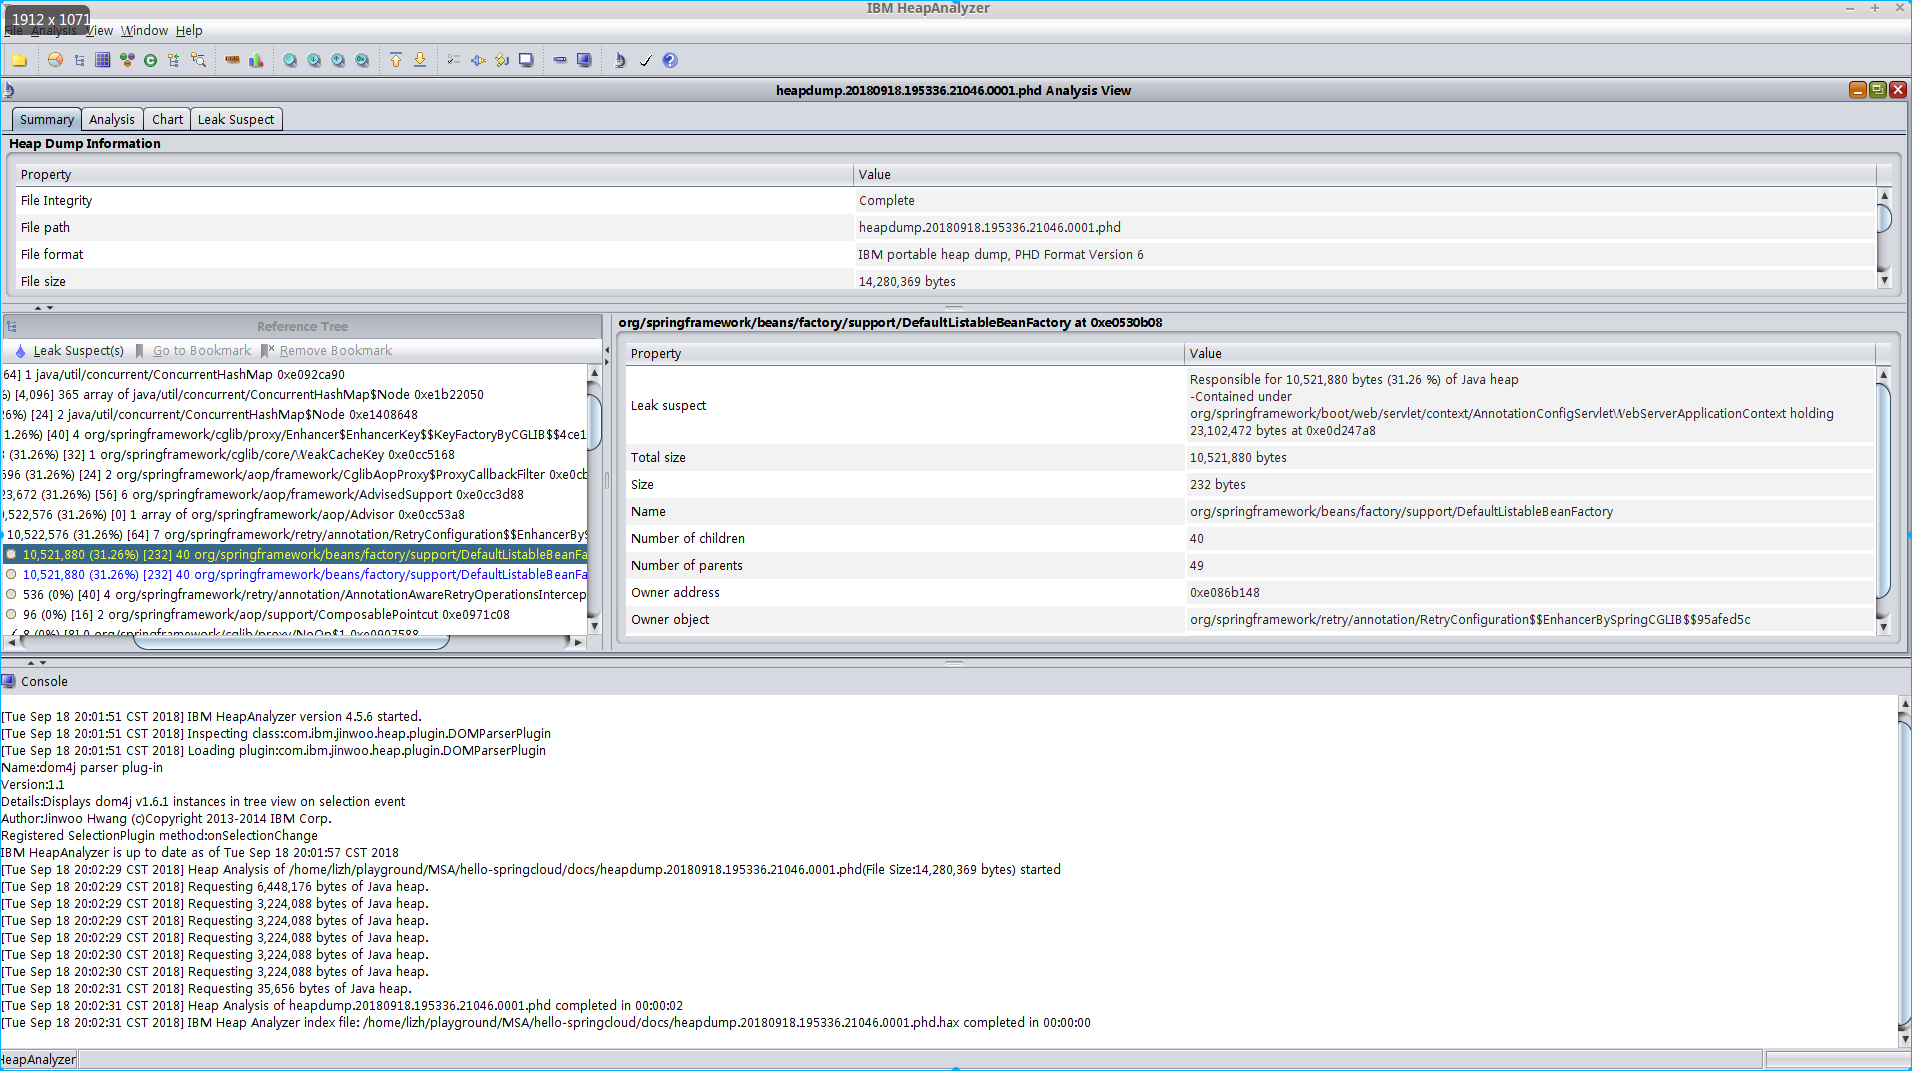
IBM JVM
To enable signal-based Java Heap dumps, the IBM_HEAPDUMP=TRUE environmental variable or the appropriate JAVA_DUMP_OPTS must be set. e.g:
# Manually trigger a heap dump by sending a SIGQUIT signal to JVM process

IBM_HEAPDUMP=TRUE ~/opt/ibm-jdk-1.8.0/bin/java -jar ./add.svc-1.0.0.jar # the pid is 21046
kill -3 21046
The heapdump file location will be printed in the java process stdout
JVMDUMP032I JVM requested Heap dump using 'heapdump.20180918.195336.21046.0001.phd' in response to an event
JVMDUMP010I Heap dump written to heapdump.20180918.195336.21046.0001.phd
Core-dump Analysis
- Oracle JVM, we commonly have 3 methods for the thread(core) dump on Linux:
- Method-1
# make you have gdb installed, which provides gcore command to do the core dump.
gcore <java pid> # e.g: pid: 7737
jstack -m -l `which java` ./core.7737 > java-7737.core
Result: java-7737.core
Note:
Before use gcore generate core dump, please run the
ulimit -ccommand to check or set the core file size limit. Make sure that the limit is set tounlimited; otherwise the core file could be truncatedjstack <executable> <core>also usually be used in postmortem situation - Method-2
You can use jstack to attach to the running java program for the thread dump
jstack -l -m -F <pid> - Method-3
kill -3 <pid> # print the dump info in the java process stdout
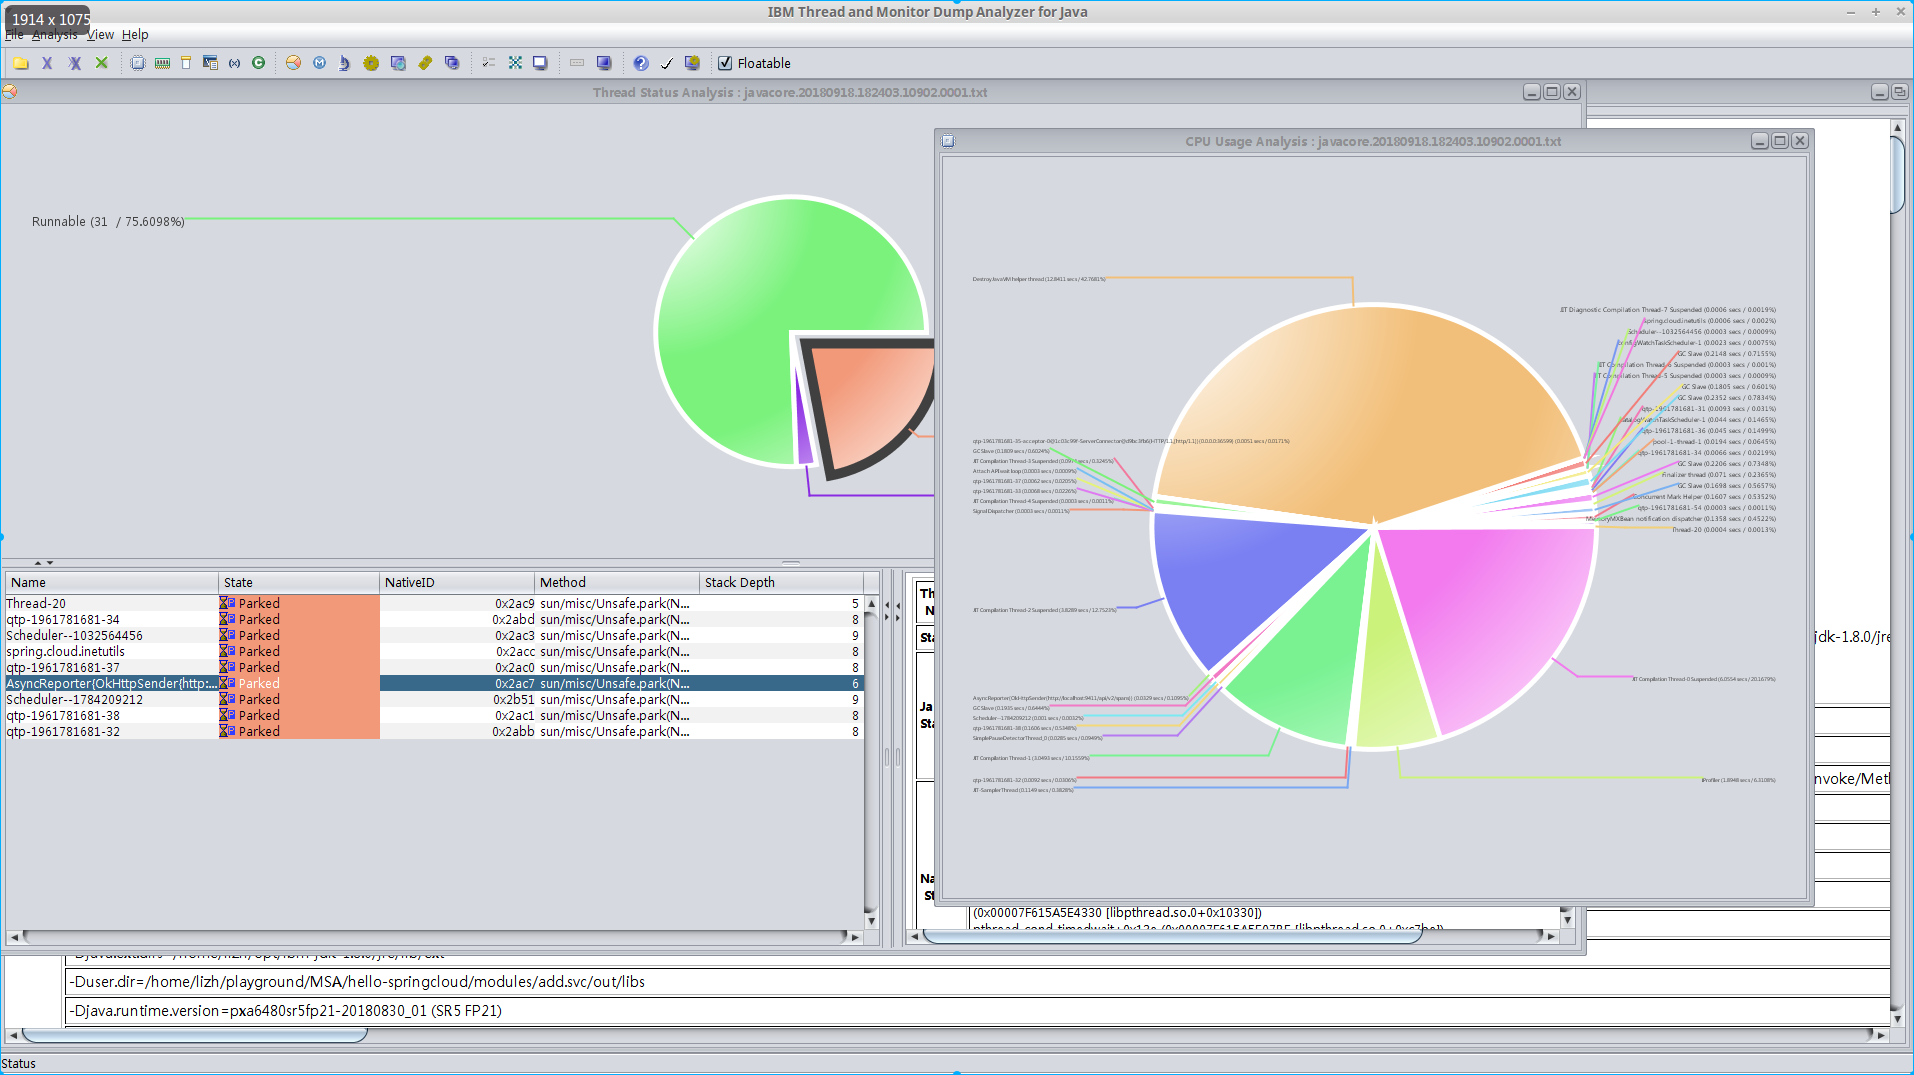
- For IBM JVM, the core dump file contains much more contents, and we can use IBM Thread and Monitor Dump Analyzer for the analysis
# Manually trigger a javacore dump by sending a SIGQUIT signal to JVM process
kill -3 <pid>
JVM log will point you to the location of javacore dump
JVMDUMP039I Processing dump event "user", detail "" at 2018/09/18 18:24:03 - please wait.
JVMDUMP032I JVM requested Java dump using 'javacore.20180918.182403.10902.0001.txt' in response to an event
JVMDUMP010I Java dump written to javacore.20180918.182403.10902.0001.txt
JVMDUMP013I Processed dump event "user", detail "".
Result:
Run sample
Run the sample in standalone mode(simulate the work on dev sandbox env)
Start Consul (listening on port 8500)
cd <CONSUL_HOME>
./bin/consul agent -dev
Start Zookeeper and Kafka(bootstrap port 9092)
cd <KAFKA_1.0_HOME>
./bin/zookeeper-server-start.sh ./config/zookeeper.properties
./bin/kafka-server-start.sh ./config/server.properties
In this sample, the api-gateway distributed tracing will be reported to Kafka topic zipkin, we can monitor that topic and verify the result:
./bin/kafka-console-consumer.sh --bootstrap-server localhost:9092 --topic zipkin
Start Zipkin Server(web-ui listening on port 9411)
Either start Zipkin by Zipkin binary
cd <ZIPKIN_SRC_HOME>
./mvnw -DskipTests --also-make -pl zipkin-server clean install
KAFKA_BOOTSTRAP_SERVERS=localhost:9092 java -jar ./zipkin-server/target/zipkin-server-2.11.2-SNAPSHOT-exec.jar
Please refer to zipkin native kafka collector auto-configure support for more details
or lanuch the Zipkin server via an embedded spring boot module
cd modules/zipkin.server
spring bootRun
Start Spring-Boot-Admin(listening on port 9080)
cd modules/springboot.admin
gradle bootRun
Start Turbine Aggration Server(listening on port 9090)
cd modules/springboot.admin
gradle bootRun
Start api-gateway (listening on port 2809)
cd modules/api.gateway
gradle bootRun
Start add service (dynamical port)
cd modules/add.svc
gradle bootRun
Start subtract service (dynamical port)
cd modules/sub.svc
gradle bootRun
Start calculator-ui service (dynamical port)
cd modules/calculator.ui
gradle bootRun
Run the sample via Command Line
curl -X POST "http://localhost:2809/calculator-ui/api/v1/compute" -H "accept: application/json" -H "Content-Type: application/json" -d "{ \"expression\": \"1+1+2+3+4+5+6-1-2-3-4-5-6+9+8-4-5\"}"
Run the sample with High load (assuming wrk is ready in your workstation)
calculator.lua:
wrk.method = "POST"
wrk.headers["Content-Type"] = "application/json"
wrk.body   = "{ \"expression\": \"1+1+2+3+4+5+6-1-2-3-4-5-6+9+8-4-5\"}"
wrk -t 200 -c 200 -s ./scripts/calculator.lua -d 60s --latency http://localhost:2809/calculator-ui/api/v1/compute
Run the sample in ops mode(simulate the work with orchestrator)
Pack
To keep the sample simple, I didn't introduce a real CI dependence(e.g: usually gitlab, jenkins, etc) here. Just create a gradle deploy task to pack the deployables to a folder named dist. Later, when the VM provisioned, the nginx will start up and provide a http pkgs server on that folder.
cd <hello_springcloud_home>
gradle clean build
gradle deploy
Launch VM
The sample is using [vagrant](https://www.vagrantup.com/docs/installation/) to manage the VM. Make sure you have vagrant installed on your host.
vagrant up
Install&Startup all of runtime dependences
All of runtime dependences, including common dependences, elasticsearch, filebeat, hashi-ui, JAVA-v8, kafka, kibana, logstash, nginx, nomad, wrk and zookeeper are managed via ansible, which will be initialized during VM provision.
vagrant provision
Start all jobs
vagrant ssh
cd /vagrant/bin
./start_all_jobs.sh
Launch Hashi-UI
Open the browser on your host with url "http://10.10.10.200:3000"
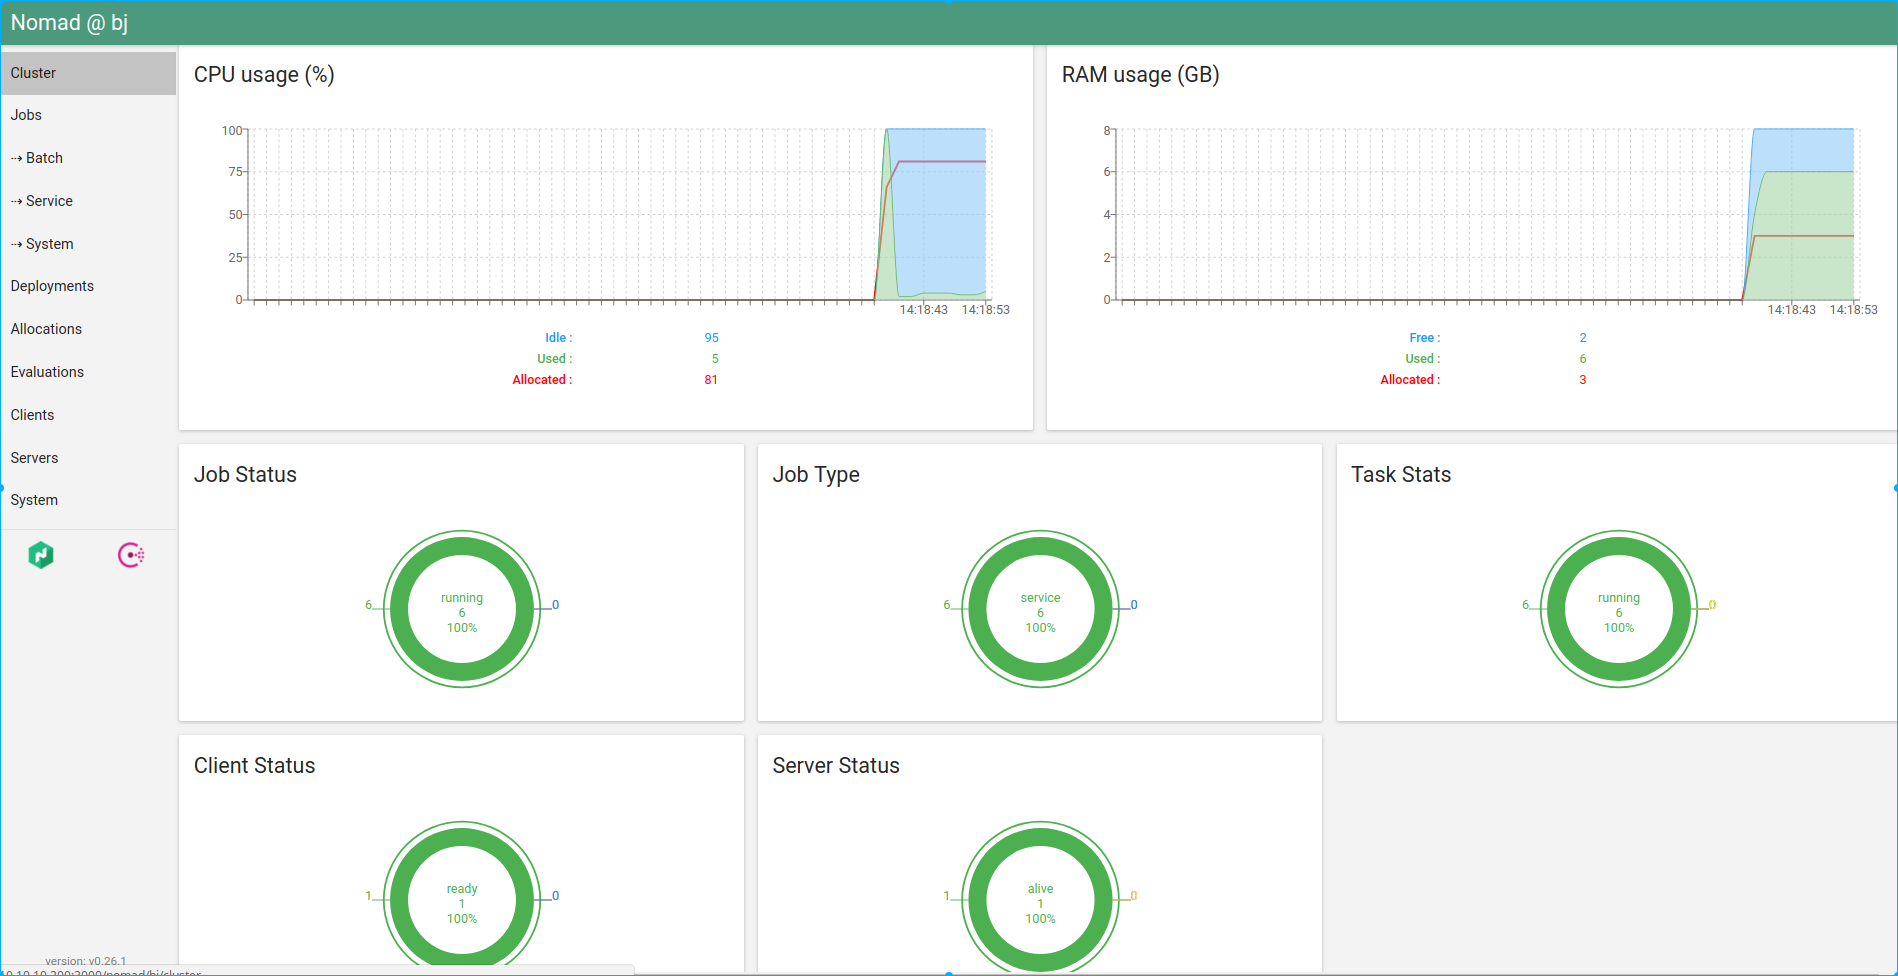
Cluster overview shown in Hashi-UI
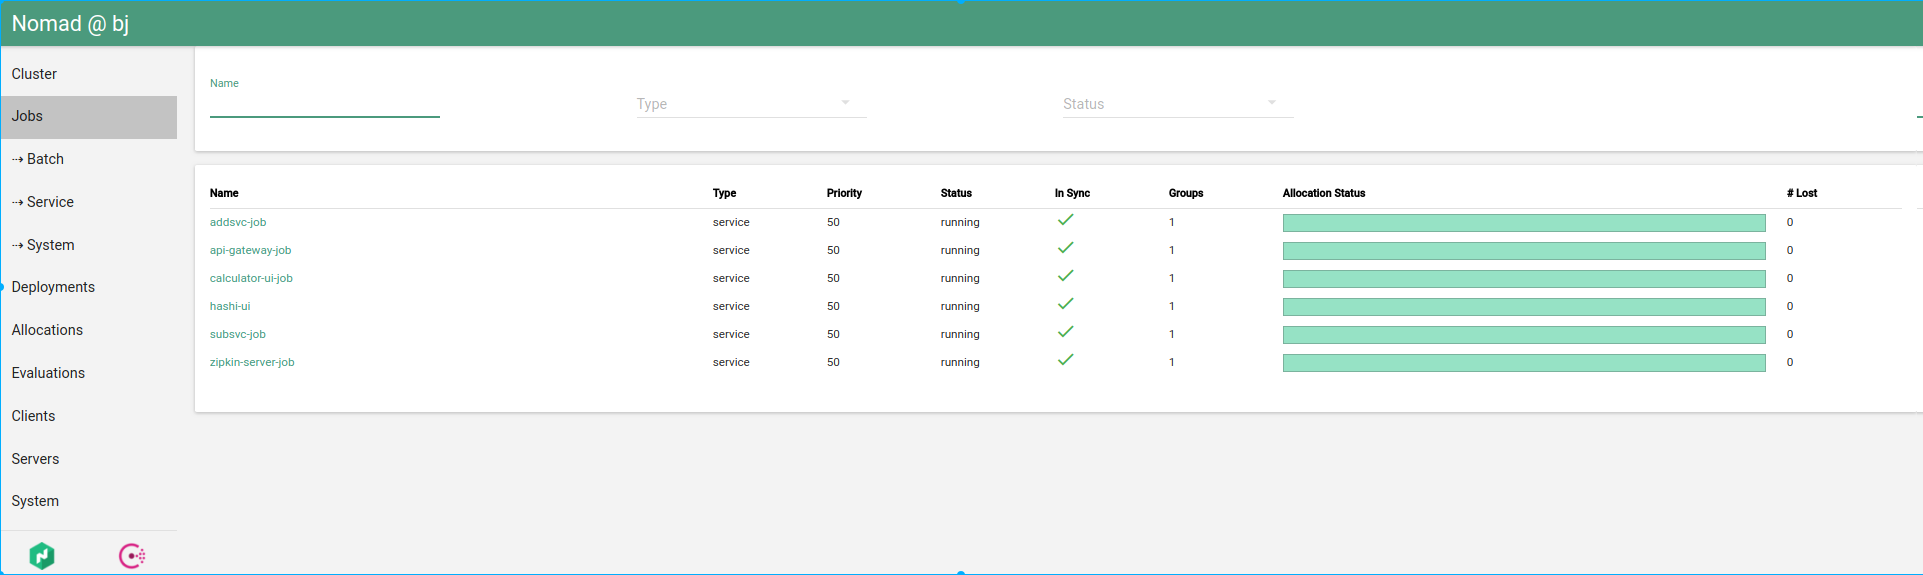
Jobs status in Hashi-UI
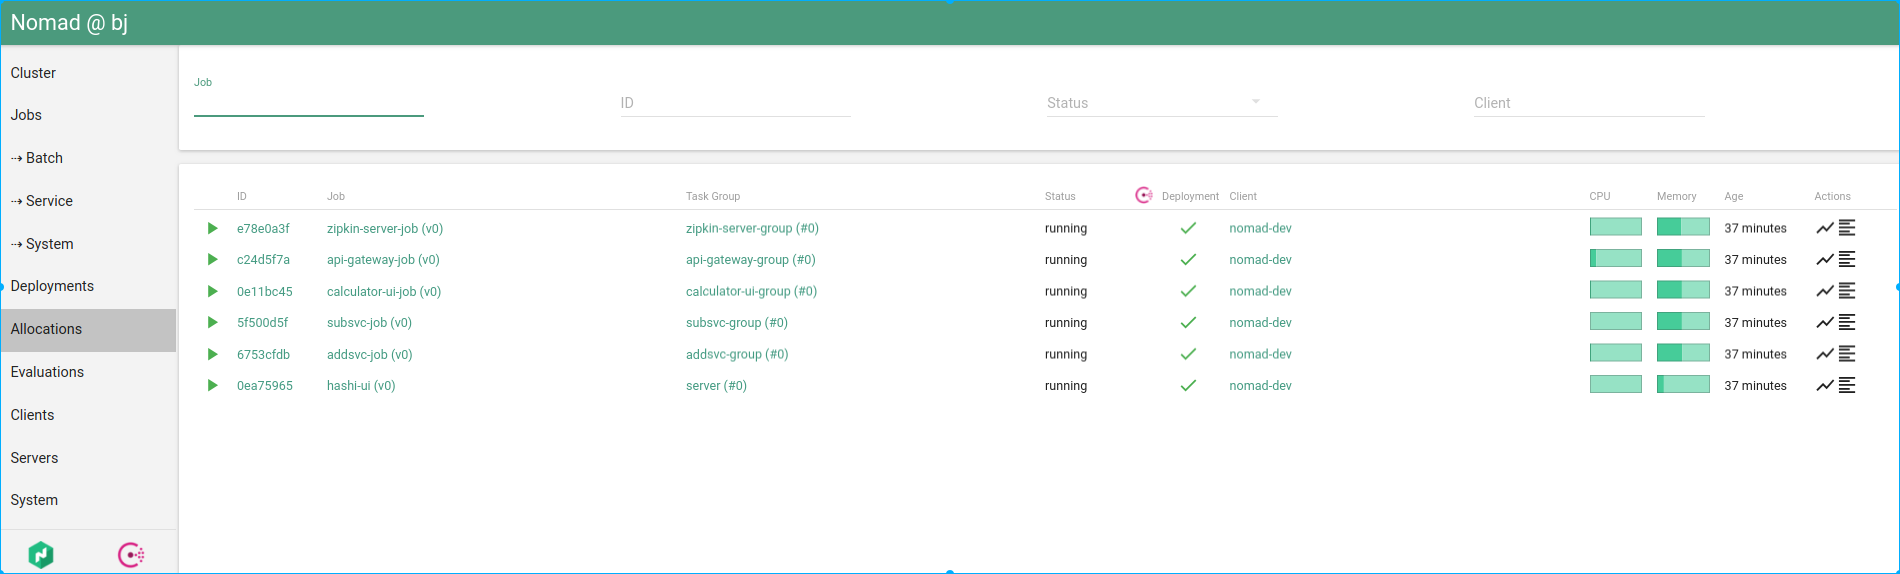
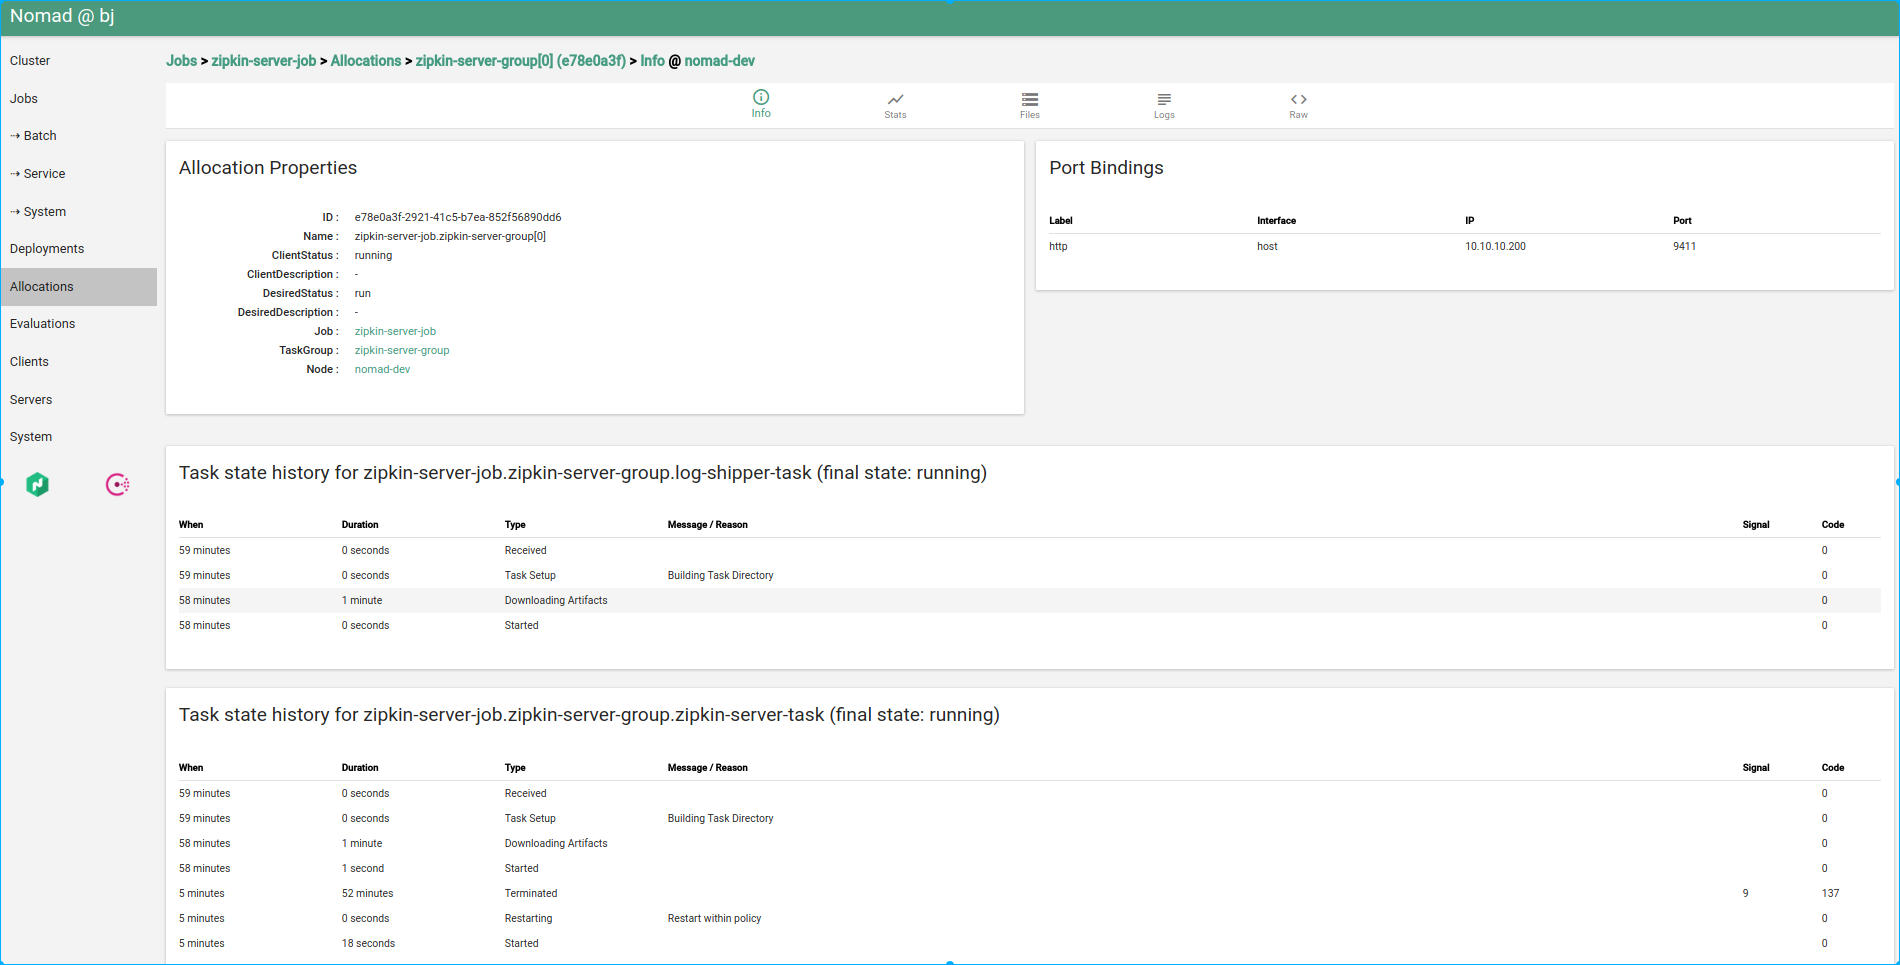
Overall allocations status in Hashi-UI
Allocation status in Hashi-UI
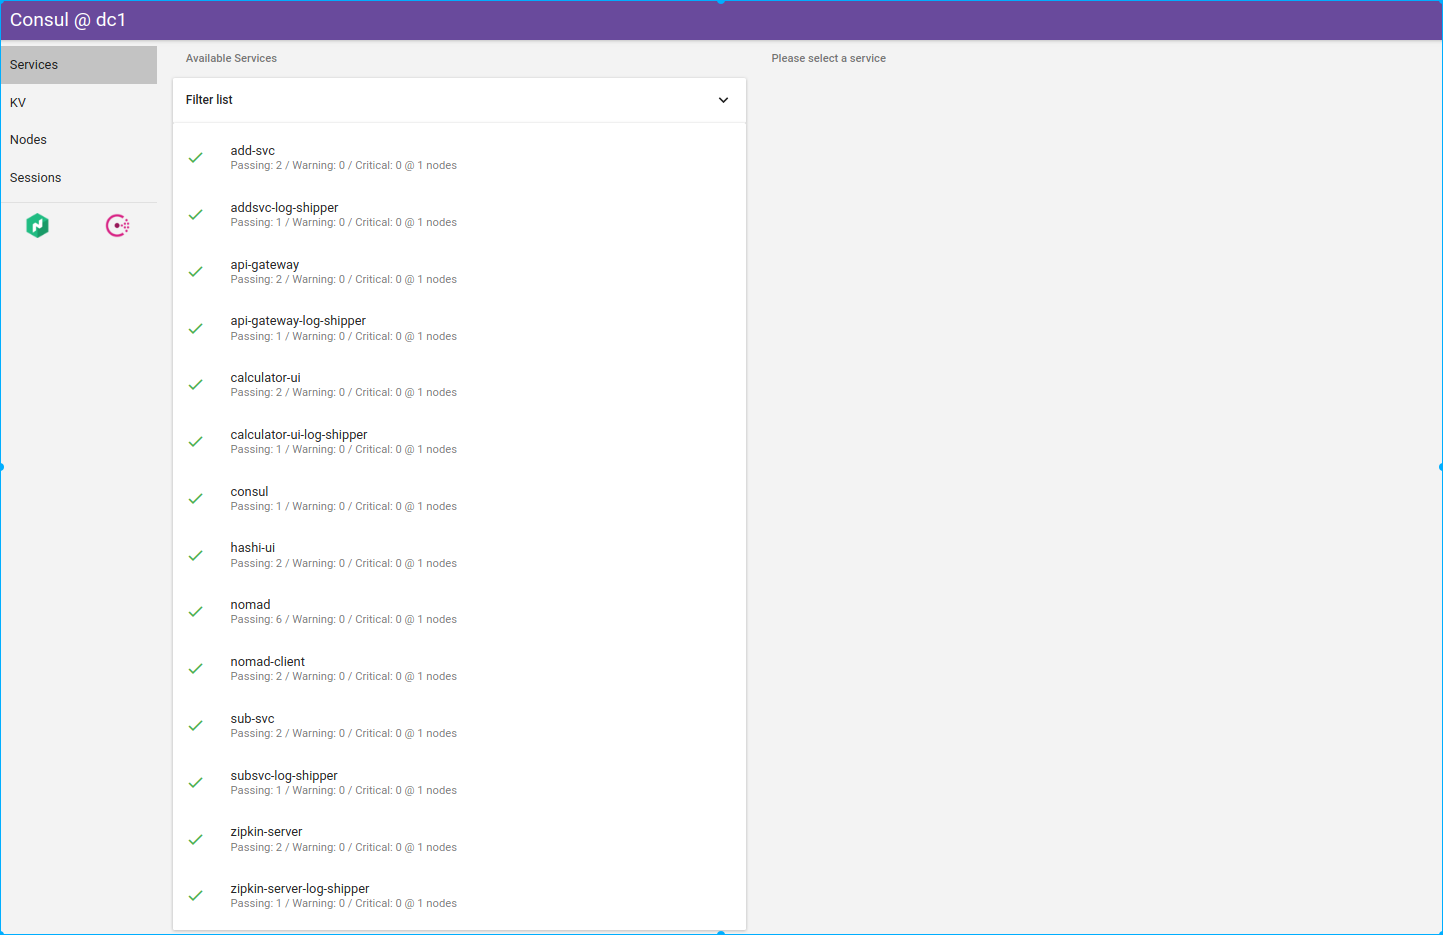
Consul status in Hashi-UI
Launch Springboot-Admin
Open the browser on your host with url "http://10.10.10.200:9080"
Run the sample
vagrant ssh
cd /vagrant/bin
./click.sh
If the sample run successfully, you will see output in stdout as below:
{"result":9}
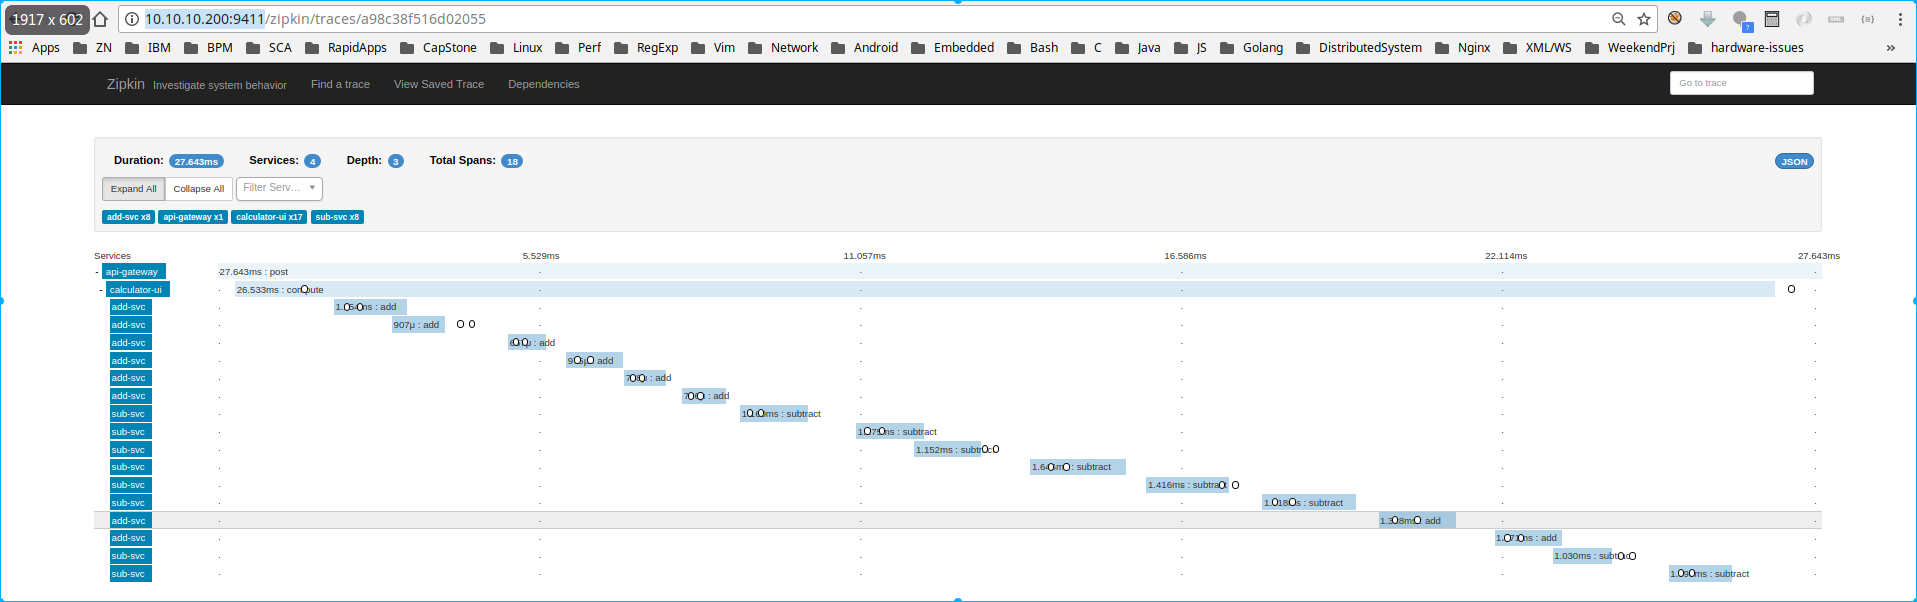
Monitor the Kafka distributed tracing topic(zipkin)
In this sample, only apigateway's distributed tracing is reported to kafka. Other services will report trace via HTTP protocol
vagrant ssh
cd /vagrant/bin
./kafka-zipkin-topic-monitor.sh
run the sample, you will see the message like below:
[{"traceId":"ebe29e701126f8a2","parentId":"ebe29e701126f8a2","id":"499be36840d38ffb","name":"post","timestamp":1536129010924681,"duration":32367,"localEndpoint":{"serviceName":"api-gateway","ipv4":"10.0.2.15"},"tags":{"component":"zuul","http.status_code":"200"}},{"traceId":"ebe29e701126f8a2","id":"ebe29e701126f8a2","kind":"SERVER","name":"post","timestamp":1536129010924004,"duration":34677,"localEndpoint":{"serviceName":"api-gateway","ipv4":"10.0.2.15"},"tags":{"component":"java-web-servlet","http.method":"POST","http.status_code":"200","http.url":"http://10.10.10.200:2809/calculator-ui/api/v1/compute"}}]
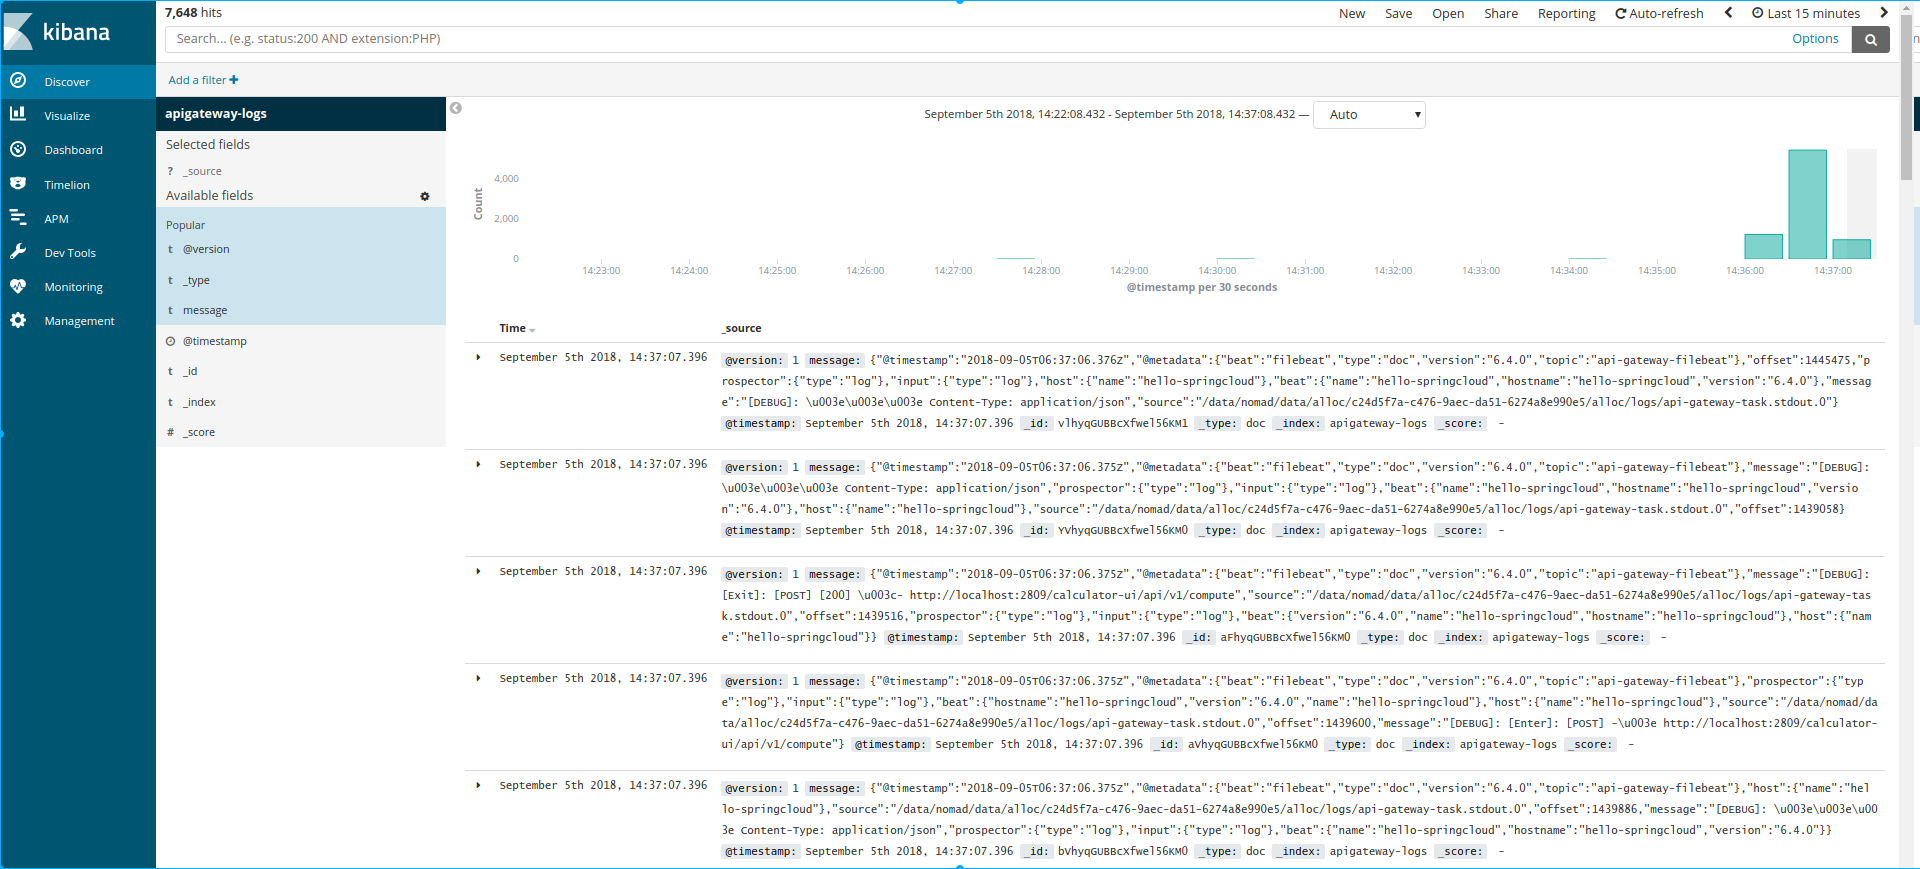
Monitor the Kafka aggregated logging topic(api-gateway-filebeat)
In this sample, only apigateway's aggregated logging is shipped to kafka. Other services will shipped to filebeat's stdout.
vagrant ssh
cd /vagrant/bin
./kafka-filebeat-topic-monitor.sh
run the sample, you will see the message like below:
{"@timestamp":"2018-09-05T06:34:20.283Z","@metadata":{"beat":"filebeat","type":"doc","version":"6.4.0","topic":"api-gateway-filebeat"},"input":{"type":"log"},"beat":{"version":"6.4.0","name":"hello-springcloud","hostname":"hello-springcloud"},"host":{"name":"hello-springcloud"},"source":"/data/nomad/data/alloc/c24d5f7a-c476-9aec-da51-6274a8e990e5/alloc/logs/api-gateway-task.stdout.0","offset":916841,"message":"[DEBUG]: [Enter]: [POST] -\u003e http://10.10.10.200:2809/calculator-ui/api/v1/compute","prospector":{"type":"log"}}
{"@timestamp":"2018-09-05T06:34:20.283Z","@metadata":{"beat":"filebeat","type":"doc","version":"6.4.0","topic":"api-gateway-filebeat"},"message":"[DEBUG]: \u003e\u003e\u003e Content-Type: application/json","source":"/data/nomad/data/alloc/c24d5f7a-c476-9aec-da51-6274a8e990e5/alloc/logs/api-gateway-task.stdout.0","offset":916923,"prospector":{"type":"log"},"input":{"type":"log"},"beat":{"name":"hello-springcloud","hostname":"hello-springcloud","version":"6.4.0"},"host":{"name":"hello-springcloud"}}
{"@timestamp":"2018-09-05T06:34:20.283Z","@metadata":{"beat":"filebeat","type":"doc","version":"6.4.0","topic":"api-gateway-filebeat"},"source":"/data/nomad/data/alloc/c24d5f7a-c476-9aec-da51-6274a8e990e5/alloc/logs/api-gateway-task.stdout.0","prospector":{"type":"log"},"input":{"type":"log"},"beat":{"name":"hello-springcloud","hostname":"hello-springcloud","version":"6.4.0"},"host":{"name":"hello-springcloud"},"offset":916967,"message":"[DEBUG]: [Exit]: [POST] [200] \u003c- http://10.10.10.200:2809/calculator-ui/api/v1/compute"}
Run benchmark
vagrant ssh
cd /vagrant/bin
./benchmark.sh
Output:
Running 1m test @ http://localhost:2809/calculator-ui/api/v1/compute
  5 threads and 5 connections
  Thread Stats   Avg      Stdev     Max   +/- Stdev
    Latency   123.07ms  158.81ms   1.88s    95.71%
    Req/Sec    11.32      6.36    40.00     56.93%
  Latency Distribution
     50%   87.95ms
     75%  138.00ms
     90%  205.89ms
     99%    1.01s
  2985 requests in 1.00m, 437.76KB read
Requests/sec:     49.72
The nmon command running in background to do the sampling, the overall system performance analysis result is hello-springcloud_180918_0439.nmon.xlsx
Distributed Tracing Result
Open browser on host machine with url http://10.10.10.200:9411
Aggregated logging
Open browser on host machine with url http://10.10.10.200:5601
Stop all jobs
vagrant ssh
cd /vagrant/bin
./stop_all_jobs.sh
Wrapping up
In this post, we introduce the embedded router mode via spring-cloud based PoC sample, in next post, we will take a hands-on practice on gateway mode for a mixed programming language scenario.
This article is Part 3 in a 7-Part Series.
- Part 1 - Build a Modern Scalable System - Basics
- Part 2 - Build a Modern Scalable System - Runtime Challenges
- Part 3 - This Article
- Part 4 - Build a Modern Scalable System - Practice on Gateway Mode For Mixed-Languages Case
- Part 5 - Build a Modern Scalable System - Practice on Service Mesh Mode with Consul and Nomad
- Part 6 - Build a Modern Scalable System - Practice on Service Mesh Mode with Consul, Nomad and Envoy
- Part 7 - Build a Modern Scalable System - Presentation of Runtime and Data Layers Challenges(in Chinese)