Exploring USDT Probes on Linux
Table of Contents
- Table of Contents
- Motivation
- Tracing System
- Linux Tracing Technical Stack
- USDT
- Enable USDT Programmatically
- Wrapping up
- Appendix
Motivation
Improve the observability and traceability of system software has become an important objective for building large complex infrastructure software. Minimizing the system overhead caused by monitoring is challenging but rewarding, as it can greatly help on the performance analysis and troubleshooting on production environment. On Linux, some well-known tracing tools like strace and ltrace can be used to tell what system calls are being made and what dynamic library calls are being made, these information are useful but still limited, also, turning on these kinds of tools will introduce an significant performance impact, this make them not very suitable for problem debugging or monitoring on the production environment.
So what is the proper way to allow programmer declare and embed the trace points into userland application, as long as instrument these trace points with an appropriate low-overhead probe during runtime, people can get the expected information about what application is doing. The USDT(Userland Statically Defined Tracing) provided by DTrace under BSD/Solaris is a successful technical reference implementation to empower this kind of feature to us. Unfortunately, for a long time, Linux did not provide out-of-box USDT probe due to insufficient support of kernel and frontend. However, in the last several years, with the continuous enhancement of kernel envent sources(e.g: uprobe) and eBPF, as well as the frontend tools such as bcc/bpftrace being implemented based on eBPF, USDT finally comes to Linux application. In this post, I will start with the Linux Tracing system concepts introductions, and then explore how USDT works in Linux.
Before we dig into USDT with more details, let's take a step back to have a look at the big picture of tracing in Linux.
THANKS to Brendan Gregg's Blog providing so much wonderful articles to help learning the knowledges in this interesting field.
Tracing System
Broadly speaking, a tracing system in linux consist of three layers: front-end, tracing framework and event sources.
Overview
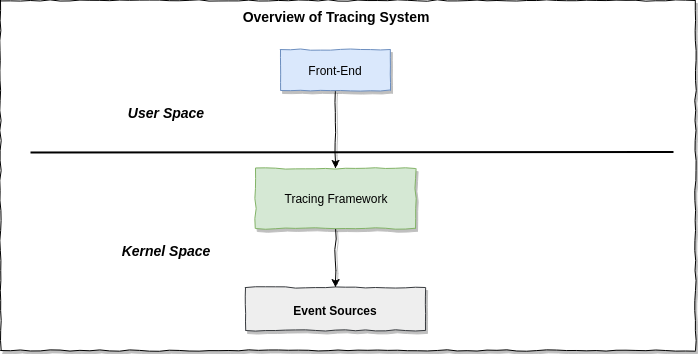
The event sources are where the tracing data comes from, tracing framework running in the kernel which responsible for data collection, counting, if it support in-kernel programmatically tracer(e.g: eBPF), it also perform the aggregation, sumarries and statistic in the efficent way. The tracing frontend tools provide user interface to communicate with tracing framework, do the statistic, sumaries and aggregation in sampling-with-post-processing-tracer(if it have) and do the result visualization to end user.
Terminology
-
ProfilingProfiling is aimed to take samples of trace events.
-
TracingTracing records every trace events.
-
ProbeAn instrumentation point in software or hardware, that generates events that can execute aggregation/summaries/statistics programs.
-
Static tracingHard-coded instrumentation points in code. Since these are fixed, they may be provided as part of a stable API, and documented.
-
Dynamic tracingAlso known as dynamic instrumentation, this is a technology that can instrument any software event, such as function calls and returns, by live modification of instruction text. Target software usually does not need special capabilities to support dynamic tracing, other than a symbol table that frontend can read. Since this instruments all software text, it is not considered a stable API, and the target functions may not be documented outside of their source code.
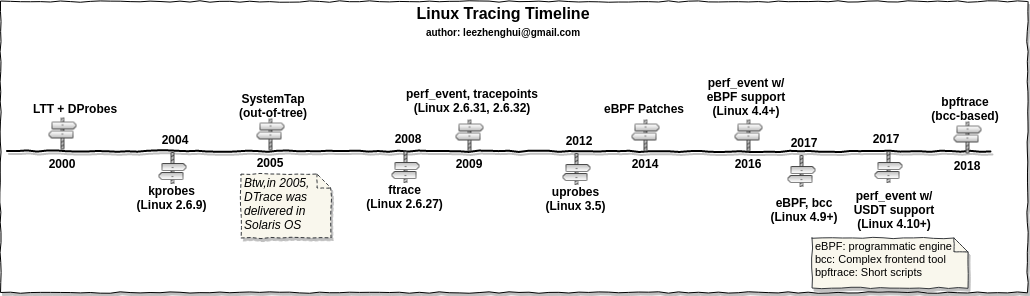
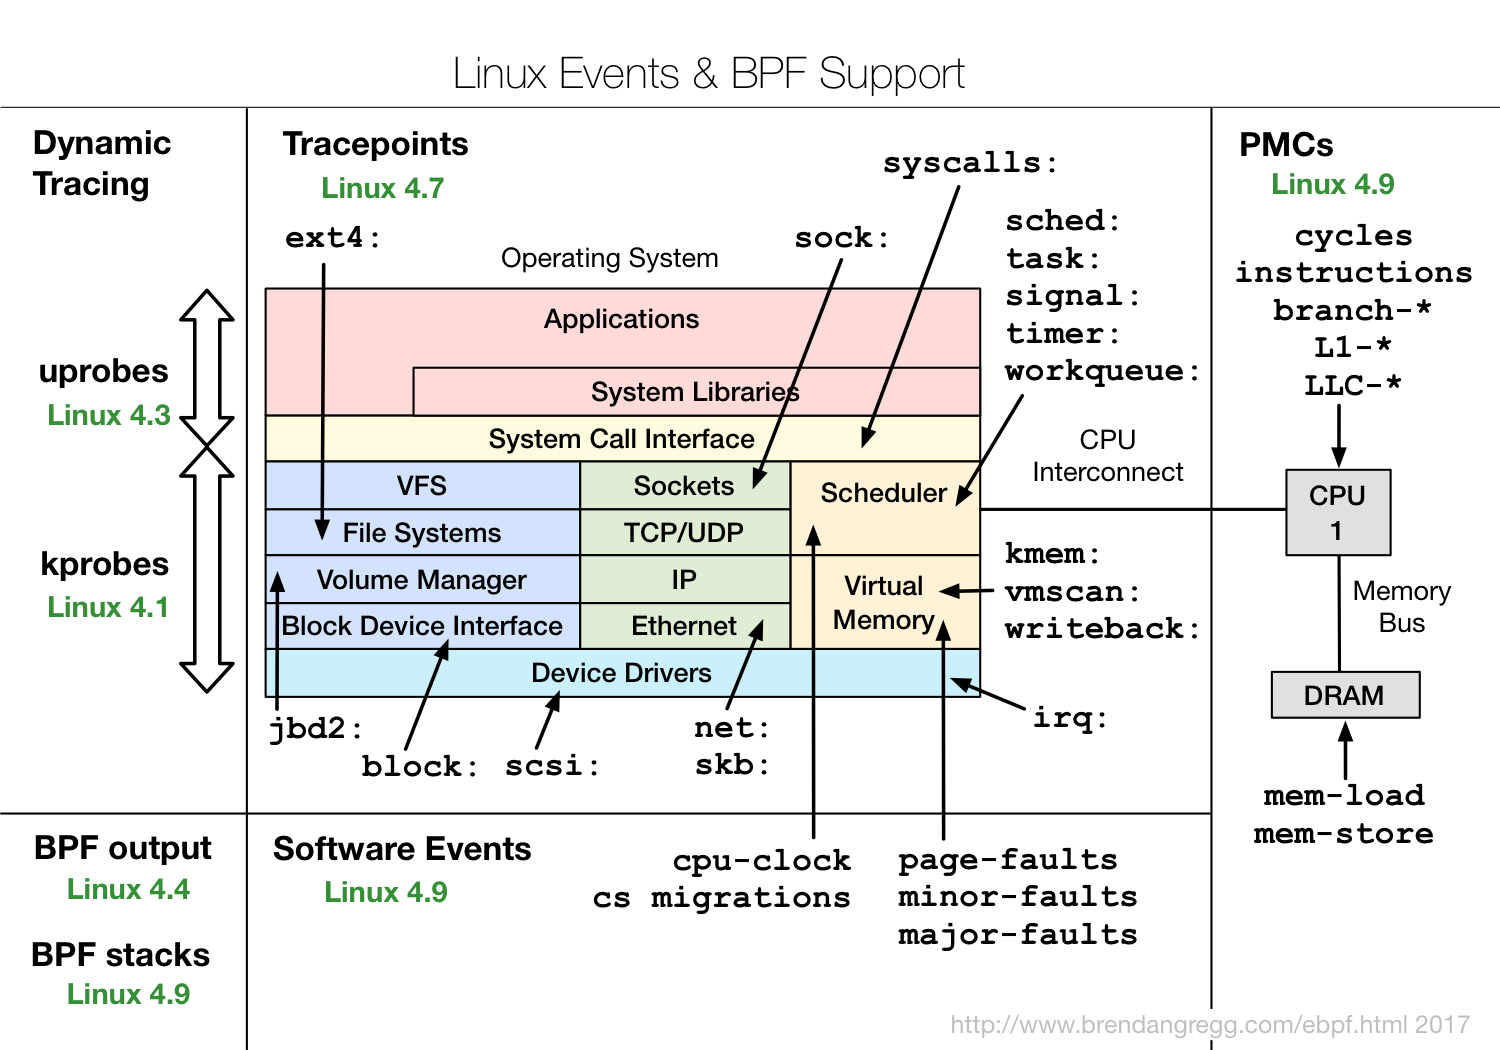
Evoluction of Linux Tracing
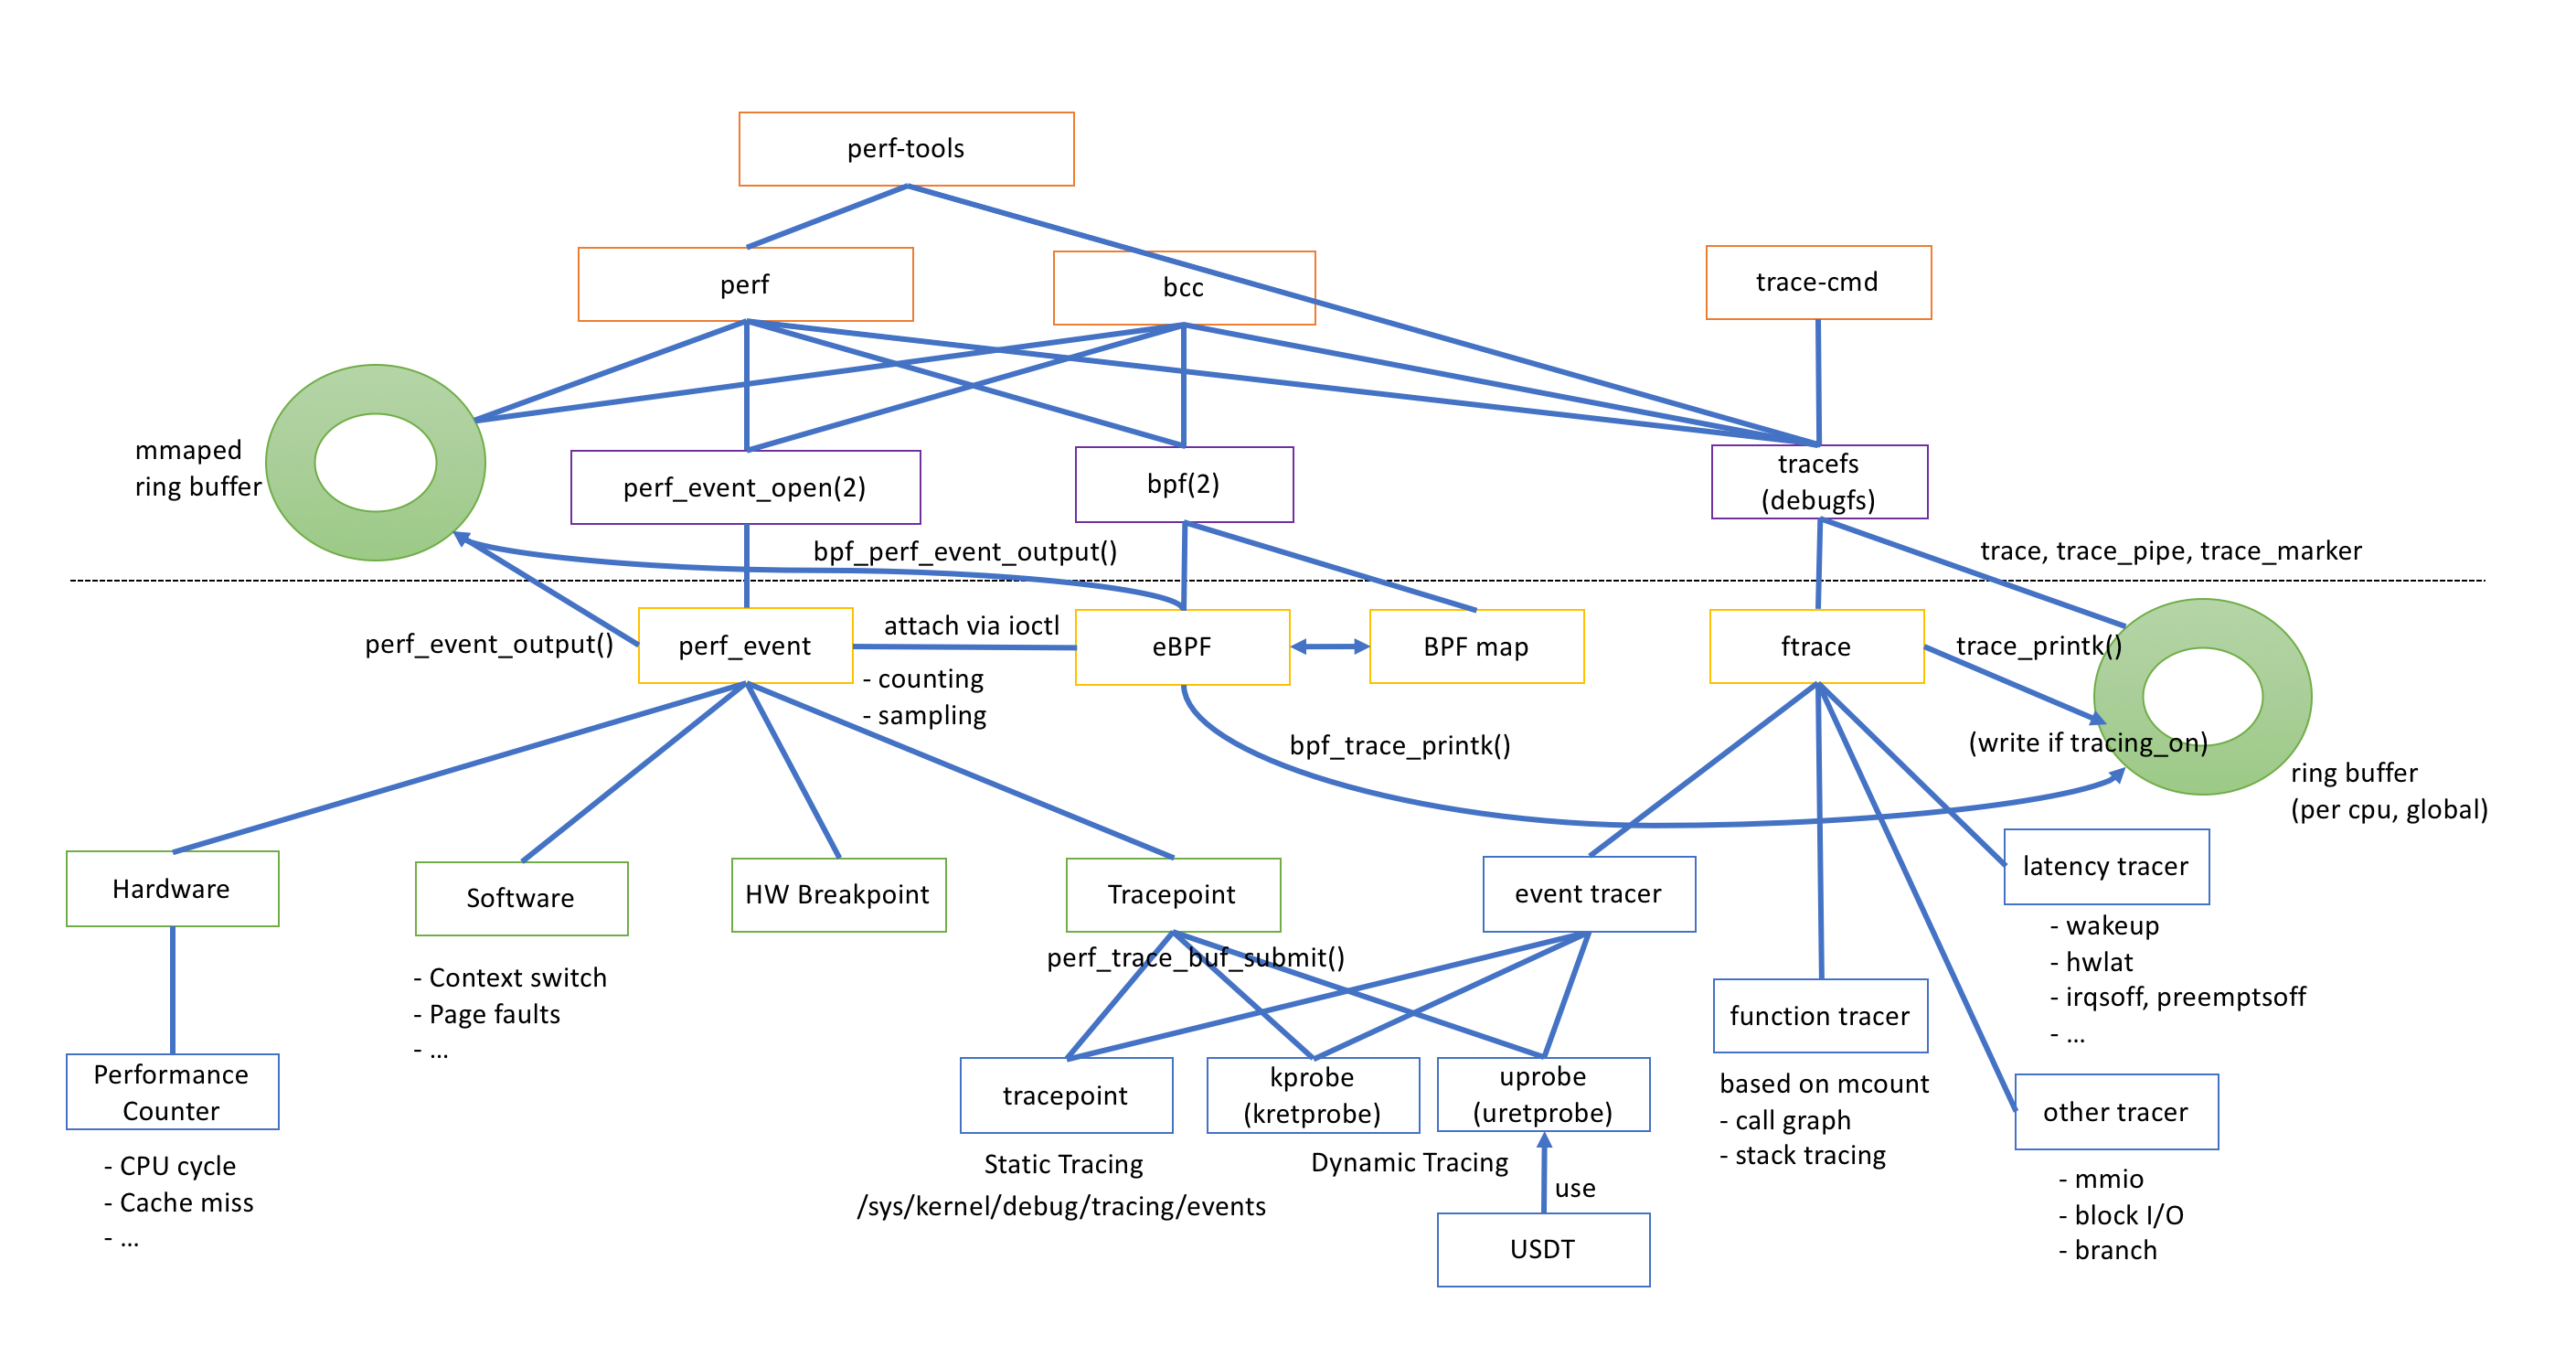
Linux Tracing Technical Stack
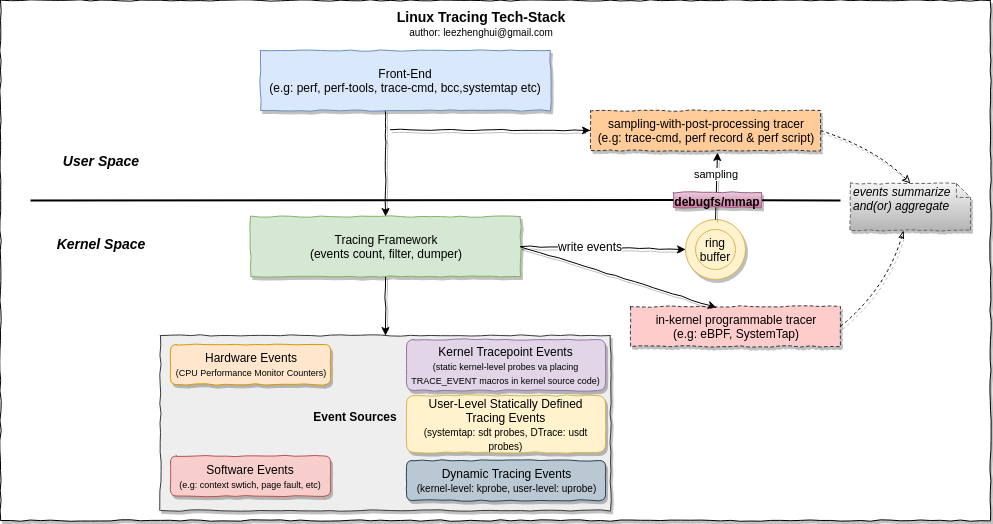
Event Sources
-
tracepoints (kernel static tracing)
A Linux kernel technology for providing static tracing.
-
kprobes (Kernel Dynamic tracing)
A Linux kernel technology for providing dynamic tracing of kernel functions.

Briefly, the kprobe work following below steps:
- User write kprobe handler in a kernel module, and install the kernel module to a running kernel
- Register the probes, after the probes are registered, the addresses at which they are active contain the breakpoint instruction (int3 on x86).
- As soon as execution reaches a probed address the int3 instruction is executed, causing the control to reach the breakpoint handler do_int3() in arch/i386/kernel/traps.c. do_int3() is called through an interrupt gate therefore interrupts are disabled when control reaches there. This handler notifies KProbes that a breakpoint occurred; KProbes checks if the breakpoint was set by the registration function of KProbes. If no probe is present at the address at which the probe was hit it simply returns 0. Otherwise the registered probe function is called.
Please refer to lwn doc An introduction to KProbes for more details.
-
uprobes (user-level Dynamic tracing)
A Linux kernel technology for providing dynamic tracing of user-level functions. Linux uprobes allows to dynamically instrument user applications, injecting programmable breakpoints at arbitrary instructions.
Please refer to Linux uprobe: User-Level Dynamic Tracing for more detailed introductions about Linux uprobe.
-
USDT/SDT
User Statically-Defined Tracing: static tracing points for user-level software. Some applications support USDT.
From gdbdoc
GDB supports SDT probes in the code. SDT stands for Statically Defined Tracing, and the probes are designed to have a tiny runtime code and data footprint, and no dynamic relocations. Currently, the following types of probes are supported on ELF-compatible systems:
- SystemTap (http://sourceware.org/systemtap/) SDT probes. SystemTap probes are usable from assembly, C and C++ languages5.
- DTrace (http://oss.oracle.com/projects/DTrace) USDT probes. DTrace probes are usable from C and C++ languages.
DTrace has long provided a C API for defining the DTrace-equivalent of USDT probes through the
DTRACE_PROBEmacro. The Linux tracing ecosystem developers decided to stay source-compatible with that API, so anyDTRACE_PROBEmacros are automatically converted to USDT probes! Adding probes to your own code is possible with SystemTap's API and the collection of DTRACE_PROBE() macros. USDT probes can help you troubleshoot your applications in production with minimal run-time overhead.
Tracing Frameworks
In-tree
-
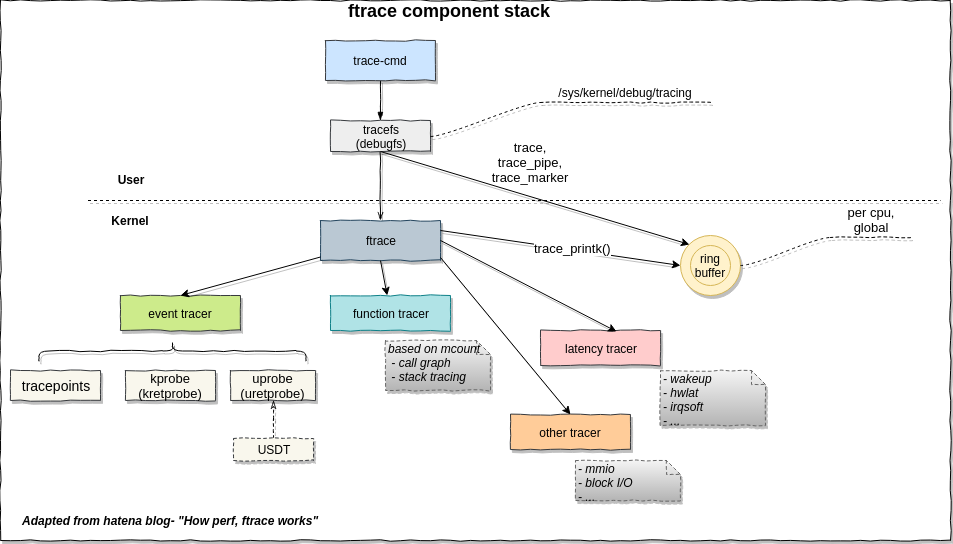
ftrace
From Choosing a Linux Tracer by Brendan Gregg
ftrace a kernel hacker's best friend. It's built into the kernel, and can consume tracepoints, kprobes, and uprobes, and provides a few capabilities: event tracing, with optional filters and arguments; event counting and timing, summarized in-kernel; and function-flow walking. See ftrace.txt from the kernel source for examples. It's controlled via /sys, and is intended for a single root user (although you could hack multi-user support using buffer instances). Its interface can be fiddly at times, but it's quite hackable, and there are front ends: Steven Rostedt, the main ftrace author, has created trace-cmd, and I've created the perf-tools collection. My biggest gripe is that it isn't programmable, so you can't, for example, save and fetch timestamps, calculate latency, and then store it as a histogram. You'll need to dump events to user-level, and post-process, at some cost. It may become programmable via eBPF.
By lwn doc Debugging the kernel using Ftrace
One of the most powerful tracers of Ftrace is the function tracer. It uses the -pg option of gcc to have every function in the kernel call a special function "mcount()". That function must be implemented in assembly because the call does not follow the normal C ABI. When CONFIG_DYNAMIC_FTRACE is configured the call is converted to a NOP at boot time to keep the system running at 100% performance. During compilation the mcount() call-sites are recorded. That list is used at boot time to convert those sites to NOPs. Since NOPs are pretty useless for tracing, the list is saved to convert the call-sites back into trace calls when the function (or function graph) tracer is enabled.
Please refer to ftrace-kernel-hooks-2014 for more introdction on ftrace.
-
perf_event
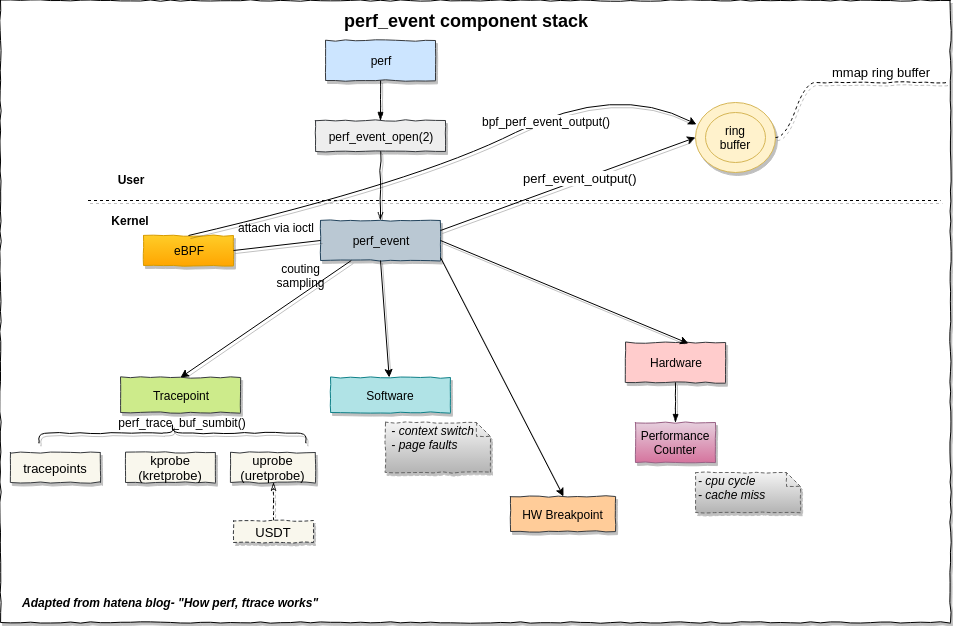
From Choosing a Linux Tracer by Brendan Gregg
perf_events is the main tracing tool for Linux users, its source is in the Linux kernel, and is usually added via a linux-tools-common package. Aka "perf", after its front end, which is typically used to trace & dump to a file (perf.data), which it does relatively efficiently (dynamic buffering), and then post-processeses that later. It can do most of what ftrace can. It can't do function-flow walking, and is a bit less hackable (as it has better safety/error checking). But it can do profiling (sampling), CPU performance counters, user-level stack translation, and can consume debuginfo for line tracing with local variables. It also supports multiple concurrent users. As with ftrace, it isn't kernel programmable yet, until perhaps eBPF support (patches have been proposed). If there's one tracer I'd recommend people learn, it'd be perf, as it can solve a ton of issues, and is relatively safe.
Event sources supported by perf_event
(Image credit: Brendan Gregg's Blog - perf Examples)
-
eBPF
From Choosing a Linux Tracer by Brendan Gregg
The extended Berkeley Packet Filter is an in-kernel virtual machine that can run programs on events, efficiently (JIT). Enhancements to BPF (Berkeley Packet Filter) which were added to the Linux 4.x series kernels, allowing BPF to do much more than just filtering packets. These enhancements allow custom analysis programs to be executed on Linux dynamic tracing, static tracing, and profiling events. It's likely to eventually provide in-kernel programming for ftrace and perf_events, and to enhance other tracers.
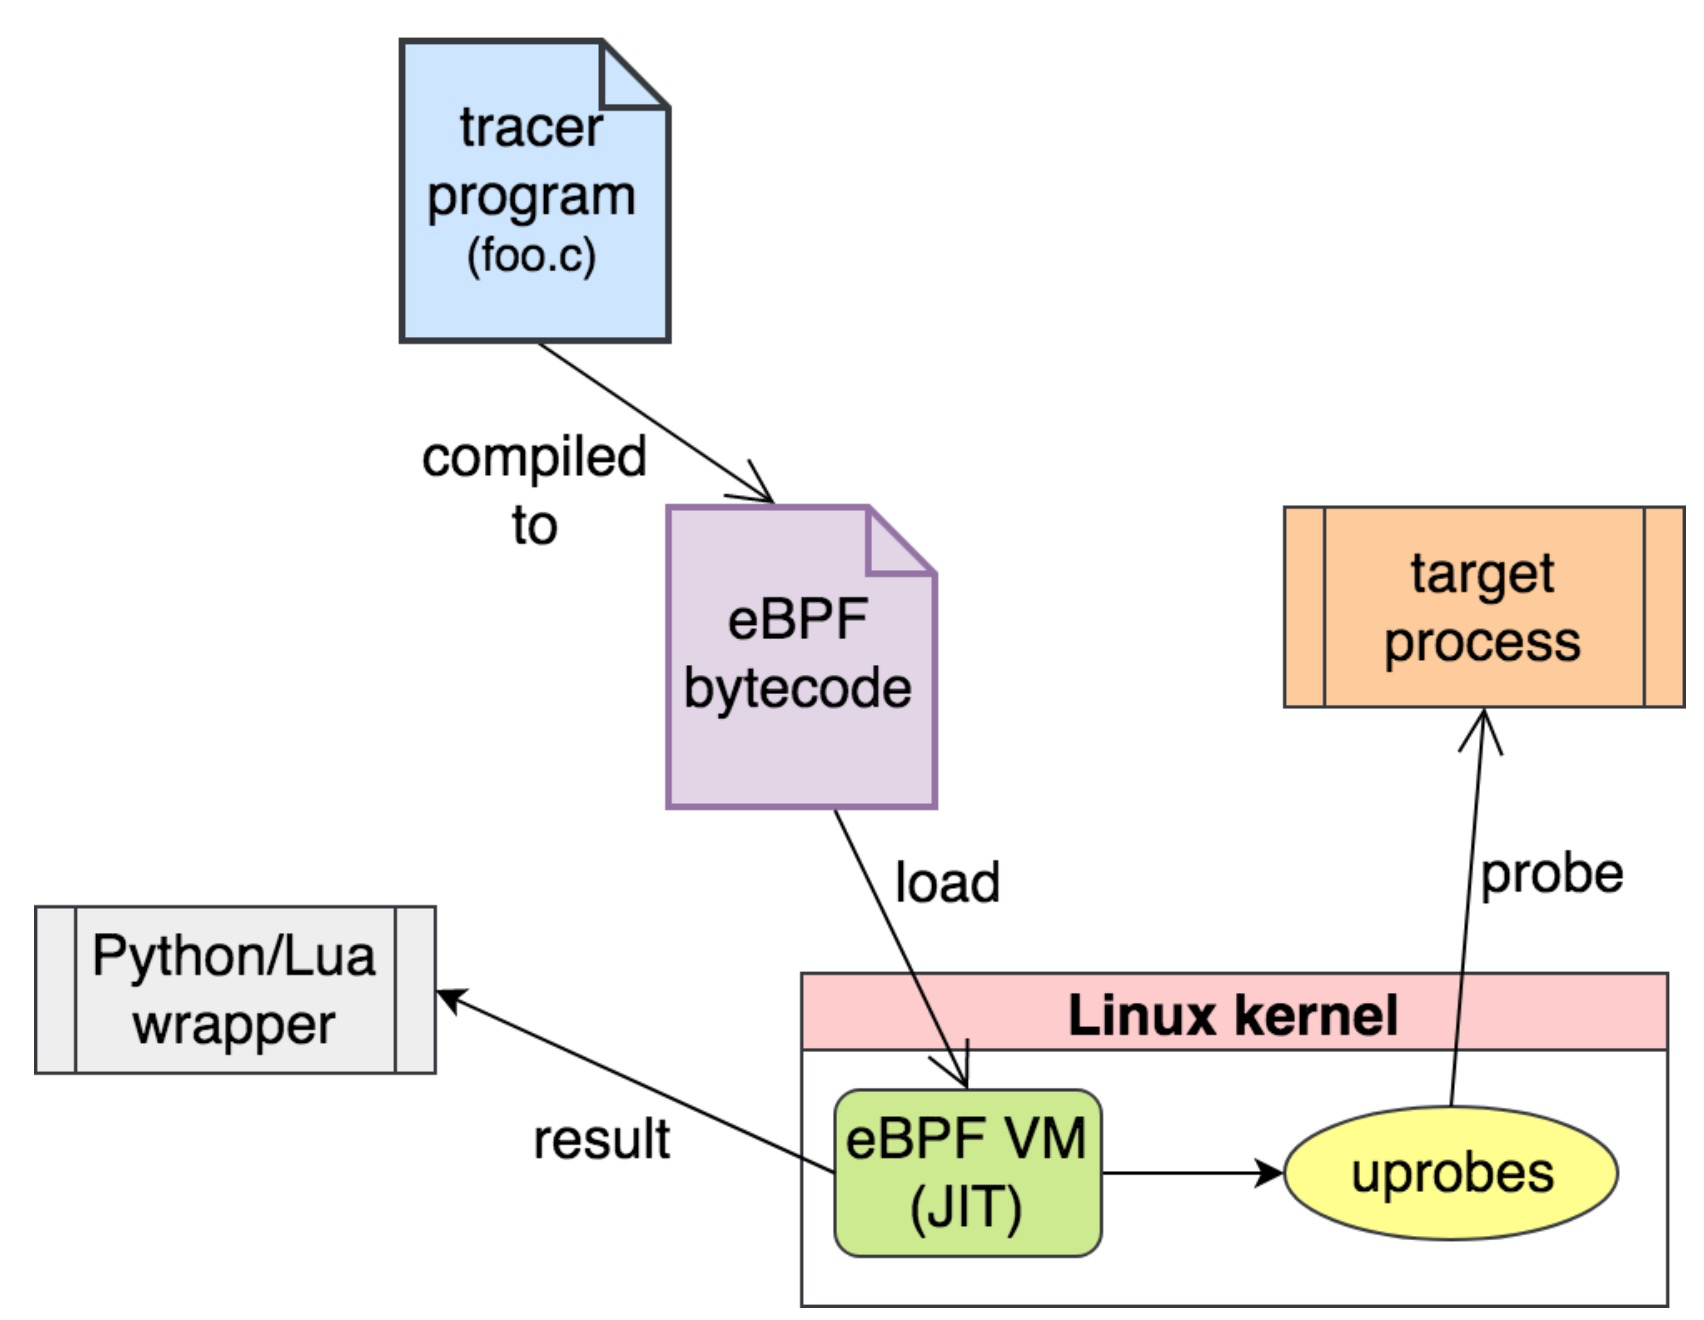
Here’s how eBPF works briefly.
- You write an “eBPF program” (often in C, or likely you use a tool that generates that program for you).
- You ask the kernel to attach that probe to a kprobe/uprobe/tracepoint/USDT-probe
- Your program writes out data to an eBPF map / ftrace / perf buffer
-
You have your precious precious data!
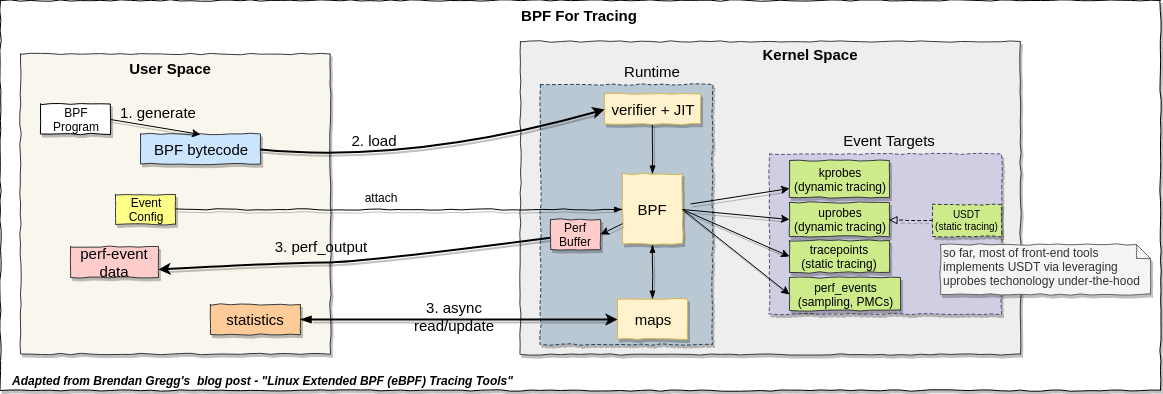
For its use with tracing, BPF provides the programmable capabilities to the existing tracing frameworks: kprobes, uprobes, and tracepoints.
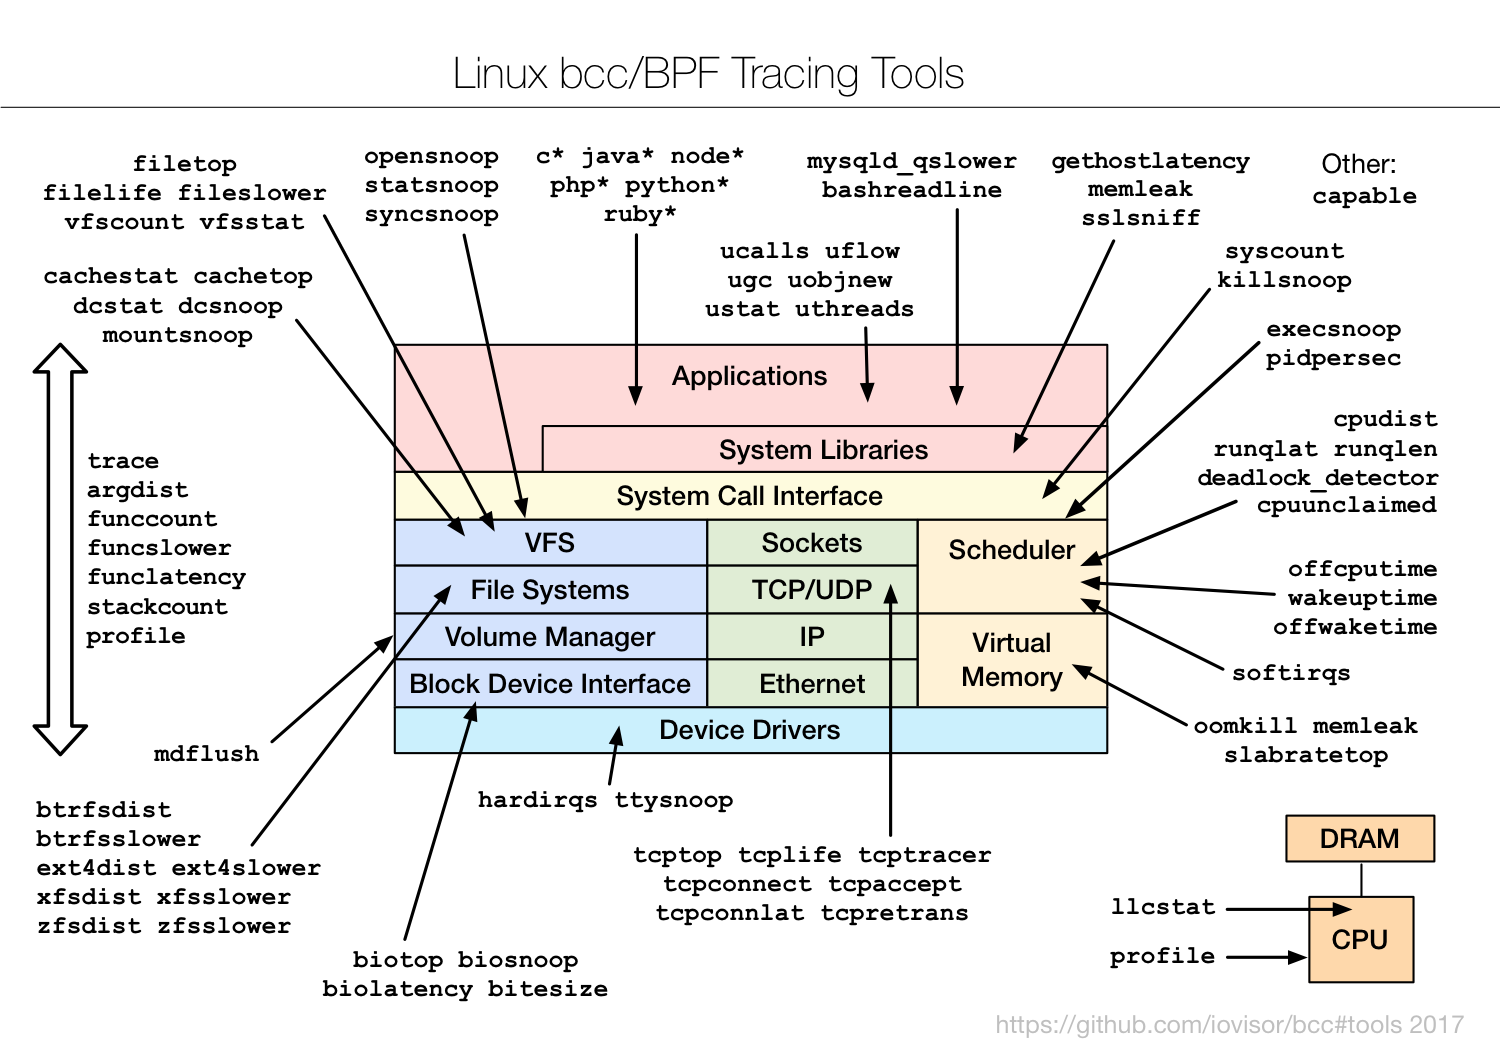
Below diagram show us the event sources supported by eBPF:
(Image credit: Brendan Gregg's Blog - Linux Extended BPF (eBPF) Tracing Tools)
(Image credit: [OpenResty slides by Yichun Zhang (@agentzh) - Tracing and Troubleshooting NGINX, OpenResty, and Their Backends)
Please refer to LWN doc - A thorough introduction to eBPF and pdf-eBPF for more details about eBPF
-
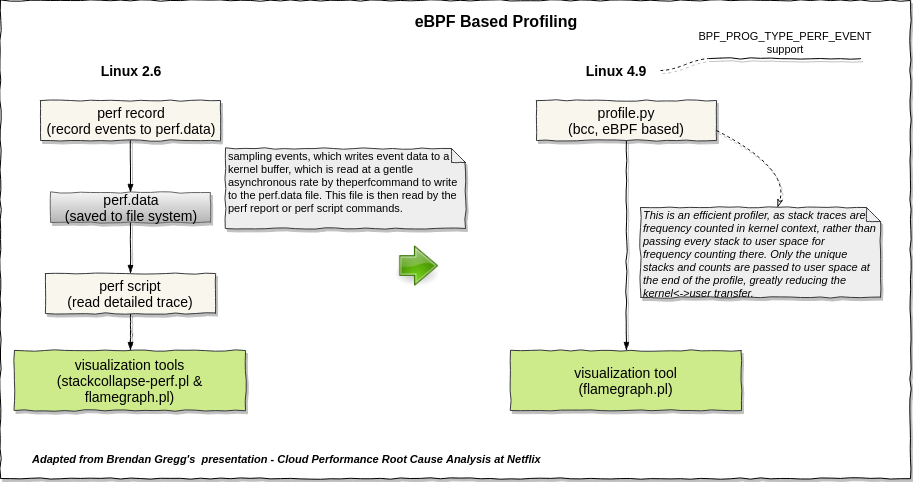
perf_event profiling vs. eBPF profiling
Compare original perf_event profiling and eBPF based profiling, the sandboxed virtual machine provided by eBPF which allow us to implement an in-kernel programmable tracer, we do not need to dump the event data into a disk for a offline analysis, therefore reduce the data transition between kernel and userspace.
Out-of-tree
-
SystemTap
From Brendan Gregg's Blog - Choosing a Linux Tracer
SystemTap is the most powerful tracer. It can do everything: profiling, tracepoints, kprobes, uprobes (which came from SystemTap), USDT, in-kernel programming, etc. It compiles programs into kernel modules and loads them – an approach which is tricky to get safe.
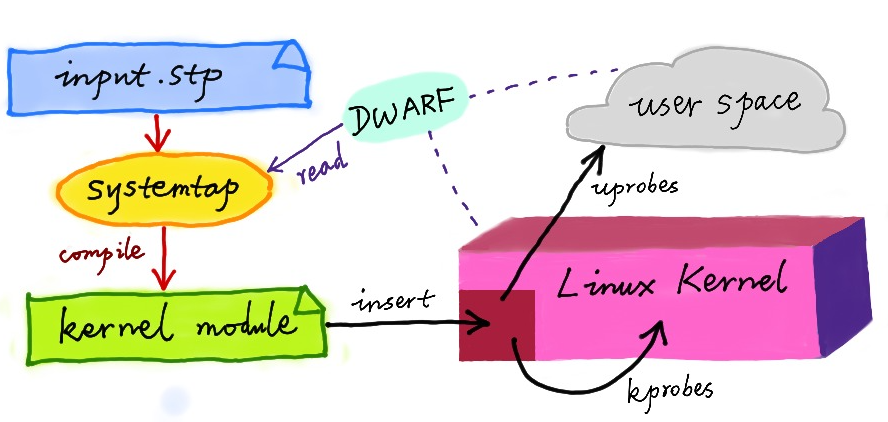
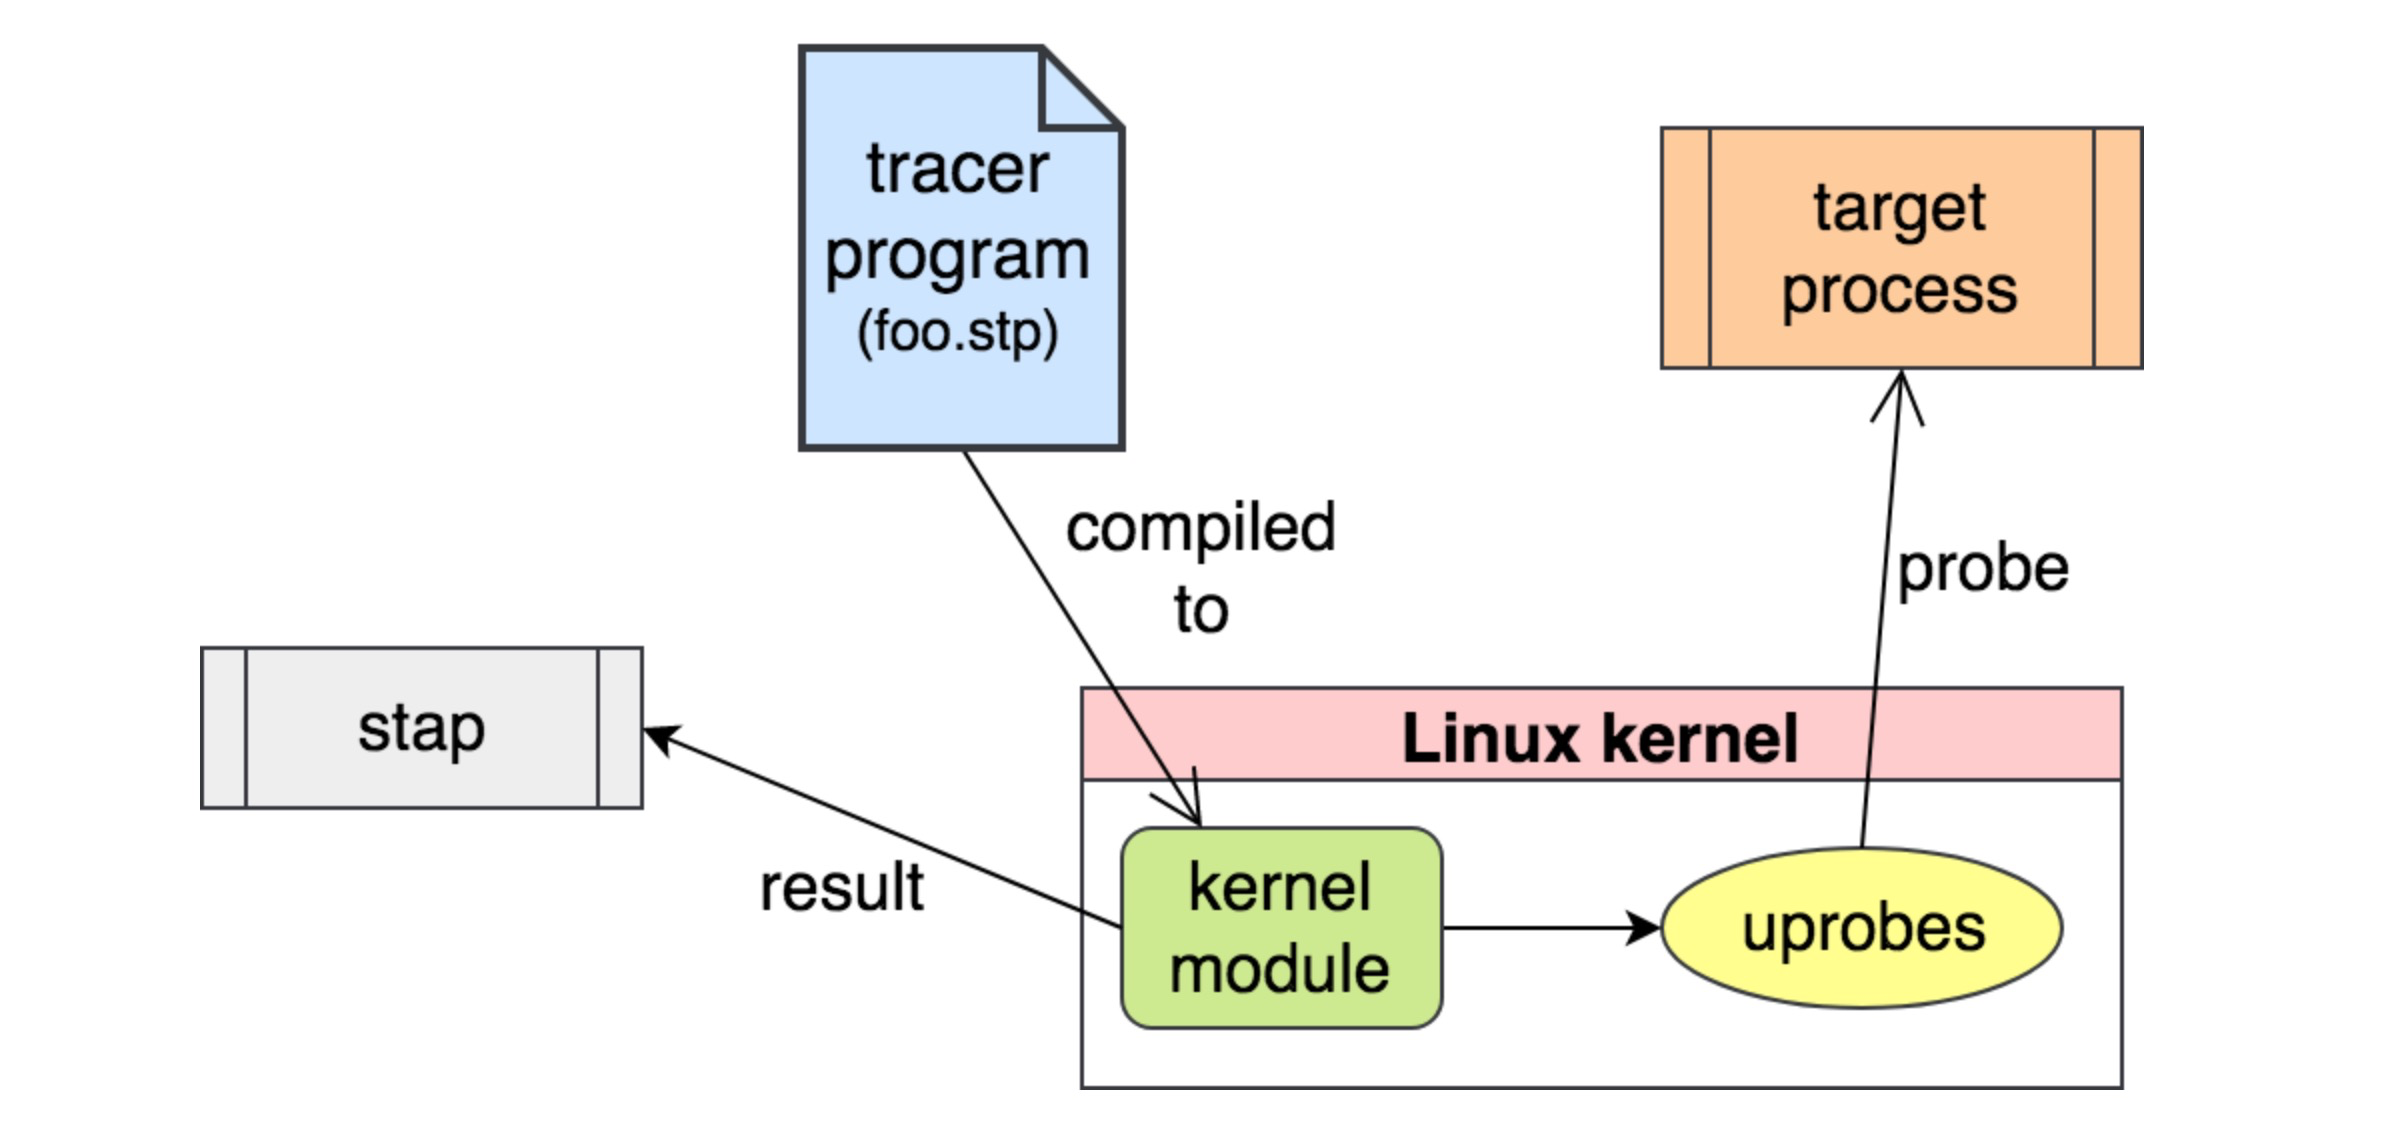
SystemTap supports: * tracepoints * kprobes * uprobes * USDT. e.g: the basic steps for tracing a kprobe is as below:
From Julia Evans's Blog - Linux tracing systems & how they fit together
-
You decide you want to trace a kprobe
-
You write a “systemtap program” & compile it into a kernel module
-
That kernel module, when inserted, creates kprobes that call code from your kernel module when triggered (it calls register_kprobe)
-
You kernel modules prints output to userspace (using relayfs or something)
(Image credit: [Yichun Zhang (@agentzh) - dynamic tracing)
(Image credit: [OpenResty slides by Yichun Zhang (@agentzh) - Tracing and Troubleshooting NGINX, OpenResty, and Their Backends)
-
-
LTTng
From Brendan Gregg's Blog - Choosing a Linux Tracer
LTTng has optimized event collection, which outperforms other tracers, and also supports numerous event types, including USDT. It is developed out of tree. The core of it is very simple: write events to a tracing buffer, via a small and fixed set of instructions. This helps make it safe and fast. The downside is that there's no easy way to do in-kernel programming.
-
ktap
From Brendan Gregg's Blog - Choosing a Linux Tracer
ktap was a really promising tracer, which used an in-kernel lua virtual machine for processing, and worked fine without debuginfo and on embedded devices. It made it into staging, and for a moment looked like it would win the trace race on Linux. Then eBPF began kernel integration, and ktap integration was postponed until it could use eBPF instead of its own VM
-
dtrace4linux
From Brendan Gregg's Blog - Choosing a Linux Tracer
dtrace4linux is mostly one man's part-time effort (Paul Fox) to port Sun DTrace to Linux. It's impressive, and some providers work, but it's some ways from complete, and is more of an experimental tool (unsafe)
-
Oracle Linux DTrace
From Brendan Gregg's Blog - Choosing a Linux Tracer
Oracle Linux DTrace is a serious effort to bring DTrace to Linux, specifically Oracle Linux. Various releases over the years have shown steady progress. The developers have even spoken about improving the DTrace test suite, which shows a promising attitude to the project. Many useful providers have already been completed: syscall, profile, sdt, proc, sched, and USDT. I'm still waiting for fbt (function boundary tracing, for kernel dynamic tracing), which will be awesome on the Linux kernel. Its ultimate success will hinge on whether it's enough to tempt people to run Oracle Linux (and pay for support). Another catch is that it may not be entirely open source: the kernel components are, but I've yet to see the user-level code.
-
DTrace
(Image credit: [OpenResty slides by Yichun Zhang (@agentzh) - Tracing and Troubleshooting NGINX, OpenResty, and Their Backends)
-
sysdig
From Brendan Gregg's Blog - Choosing a Linux Tracer
sysdig is a new tracer that can operate on syscall events with tcpdump-like syntax, and lua post processing. It's impressive, and it's great to see innovation in the system tracing space. Its limitations are that it is syscalls only at the moment, and, that it dumps all events to user-level for post processing. You can do a lot with syscalls, although I'd like to see it support tracepoints, kprobes, and uprobes. I'd also like to see it support eBPF, for in-kernel summaries. The sysdig developers are currently adding container support. Watch this space.
Tracing Frontends
-
ftrace
ftrace use a virtual file sysatem -
/sys/kernel/debug/tracingas the user interface. -
perf (for perf_event only)
perf is a function for performance monitoring that exists in Linux . Also called perf_event. Tools for user space named perf have also been developed, and if you simply say perf, you probably point to this tool. For a bit confusing, here we will write perf_event as the kernel 's function.
-
trace-cmd (for ftrace only)
It is a frontend for ftrace, you can use it to collect and display ftrace data
Please refer to good article ftrace: trace your kernel functions for more details.
-
perf-tools (a wrapper of ftrace and perf_event)
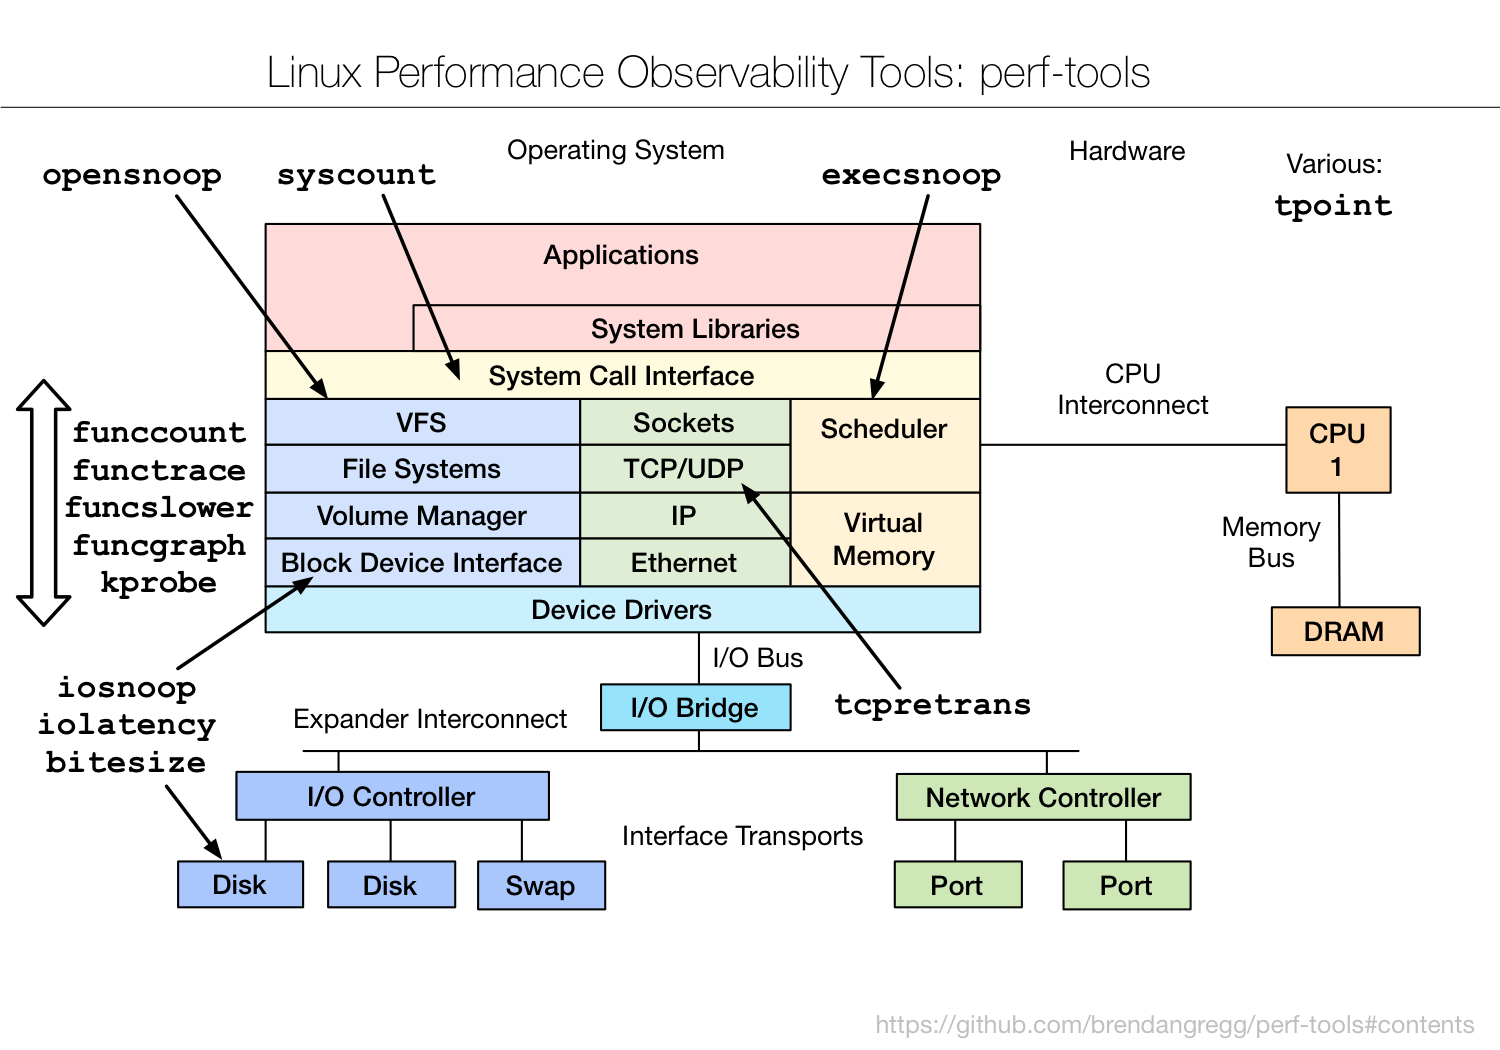
Deps Feature Comments ftrace iosnoop trace disk I/O with details including latency iolatency summarize disk I/O latency as a histogram execsnoop trace process exec() with command line argument details opensnoop trace open() syscalls showing filenames killsnoop trace kill() signals showing process and signal details fs/cachestat basic cache hit/miss statistics for the Linux page cache net/tcpretrans show TCP retransmits, with address and other details system/tpoint trace a given tracepoint kernel/funccount count kernel function calls, matching a string with wildcards kernel/functrace trace kernel function calls, matching a string with wildcards kernel/funcslower trace kernel functions slower than a threshold kernel/funcgraph trace a graph of kernel function calls, showing children and times kernel/kprobe dynamically trace a kernel function call or its return, with variables user/uprobe dynamically trace a user-level function call or its return, with variables *user/usdt It is just a PoC sample script which being used in article, not been included in the toolkit, usdt(ftrace) tools/reset-ftrace reset ftrace state if needed perf_events misc/perf-stat-hist power-of aggregations for tracepoint variables syscount count syscalls by syscall or process disk/bitesize histogram summary of disk I/O size -
bcc (eBPF-based)
From bcc
bccis a toolkit for creating efficient kernel tracing and manipulation programs, and includes several useful tools and examples. It makes use of extended BPF (Berkeley Packet Filters), formally known as eBPF, a new feature that was first added to Linux 3.15. Much of what bcc uses requires Linux 4.1 and above. bcc makes BPF programs easier to write, with kernel instrumentation in C (and includes a C wrapper around LLVM), and front-ends in Python and lua. It is suited for many tasks, including performance analysis and network traffic control.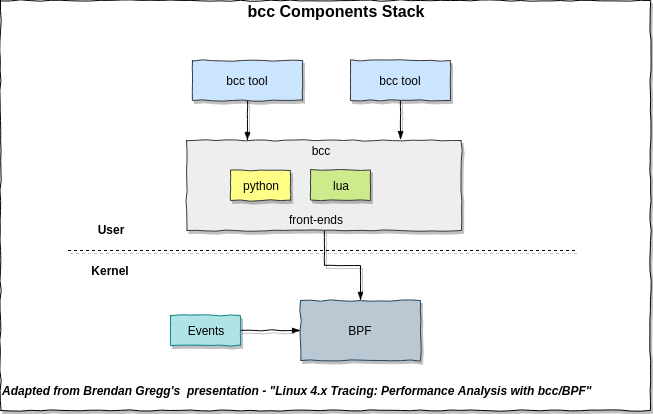
The straightforward way for USDT implementation is based on uprobe approach. see below for the solution disscusion:
From bcc github issue-327
on the iovisor call today (11am PST biweekly) we briefly discussed that there were at least 3 ways to do USDT probes. This way, using uprobes, is the most obvious and immediate solution, and we should go ahead with it. But later on (much later on) we might investigate other approaches in addition or instead of, including LD_PRELOAD so that tracing can be user-mode to user-mode, reducing overhead. These other approaches should greatly reduce the overhead of memleak too.
Events:
From bcc reference guide
- kprobes
- kretprobes
- Tracepoints
- uprobes
- uretprobes
- USDT probes
- Raw Tracepoints
- system call tracepoints
USDT probes:
From bcc reference guide
These are User Statically-Defined Tracing (USDT) probes, which may be placed in some applications or libraries to provide a user-level equivalent of tracepoints. The primary BPF method provided for USDT support method is enable_probe(). USDT probes are instrumented by declaring a normal function in C, then associating it as a USDT probe in Python via USDT.enable_probe().
Arguments can be read via: bpf_usdt_readarg(index, ctx, &addr)
-
bpftrace
From github High-level tracing language for Linux eBPF
BPFtrace is a high-level tracing language for Linux enhanced Berkeley Packet Filter (eBPF) available in recent Linux kernels (4.x). BPFtrace uses LLVM as a backend to compile scripts to BPF-bytecode and makes use of BCC for interacting with the Linux BPF system, as well as existing Linux tracing capabilities: kernel dynamic tracing (kprobes), user-level dynamic tracing (uprobes), and tracepoints. The BPFtrace language is inspired by awk and C, and predecessor tracers such as DTrace and SystemTap.
From github bpftrace reference doc
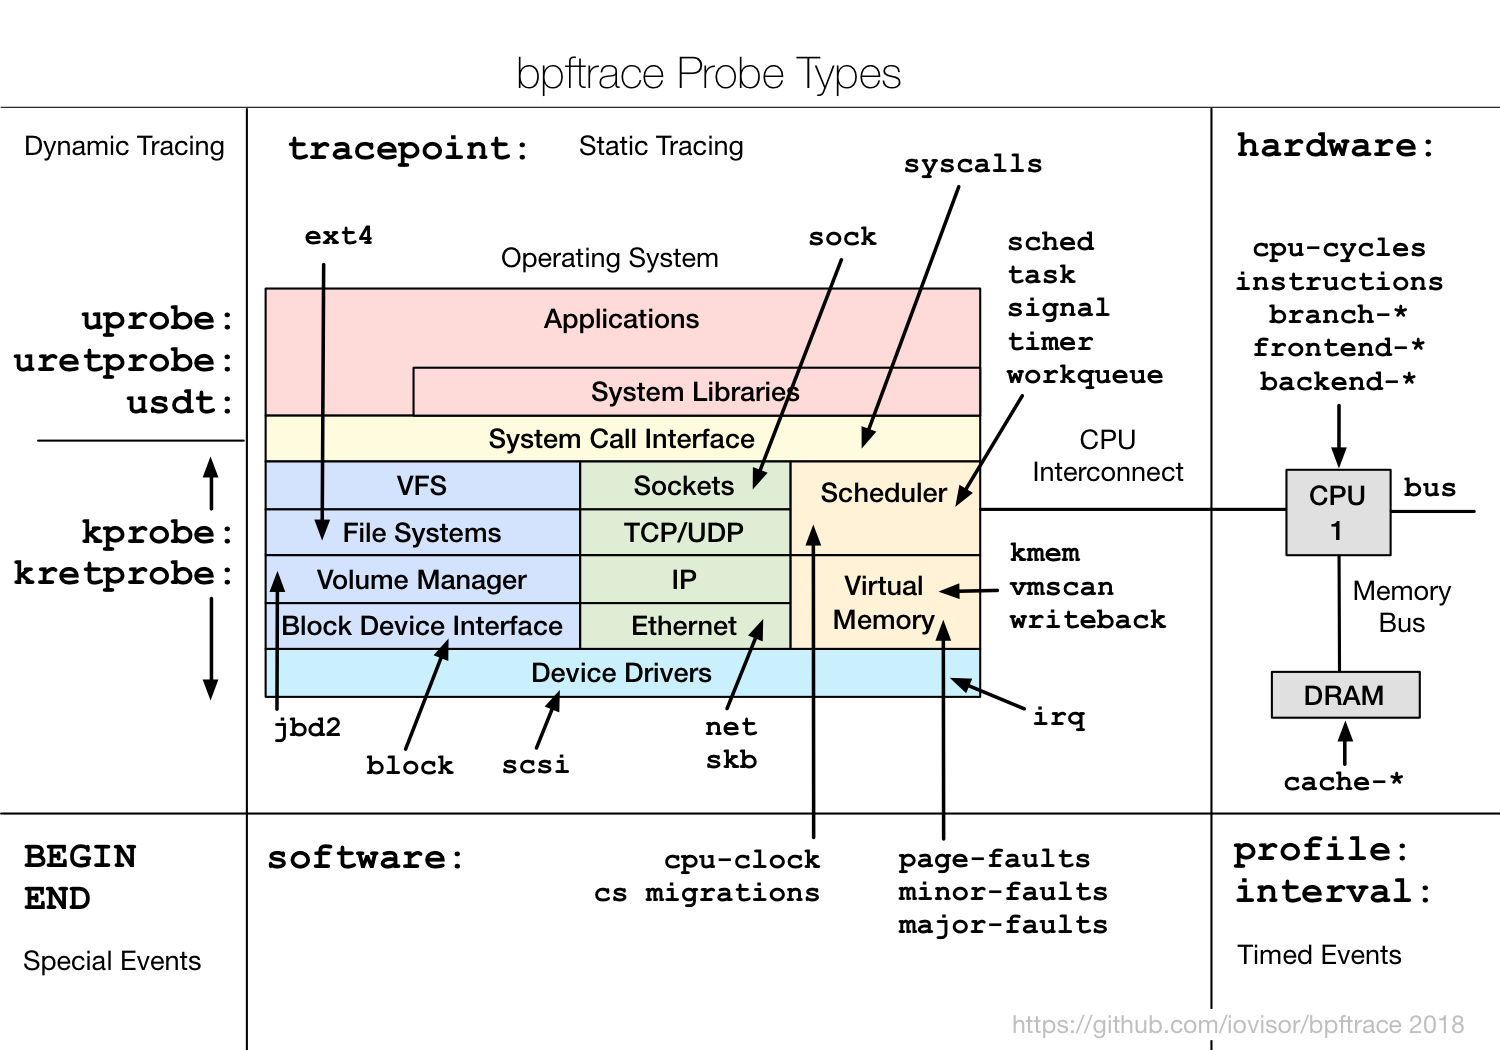
Supported probes:
- kprobe - kernel function start
- kretprobe - kernel function return
- uprobe - user-level function start
- uretprobe - user-level function return
- tracepoint - kernel static tracepoints
- usdt - user-level static tracepoints
- profile - timed sampling
- interval - timed output
- software - kernel software events
- hardware - processor-level events
USDT probes:
From github bpftrace reference doc
Syntax:
usdt:binary_path:probe_name
usdt:binary_path:[probe_namespace]:probe_name
usdt:library_path:probe_name
usdt:library_path:[probe_namespace]:probe_name > usdt: Static Tracing, User-Level Arguments
e.g:
bpftrace -e 'usdt:/root/tick:loop { printf("%s: %d\n", str(arg0), arg1); }'
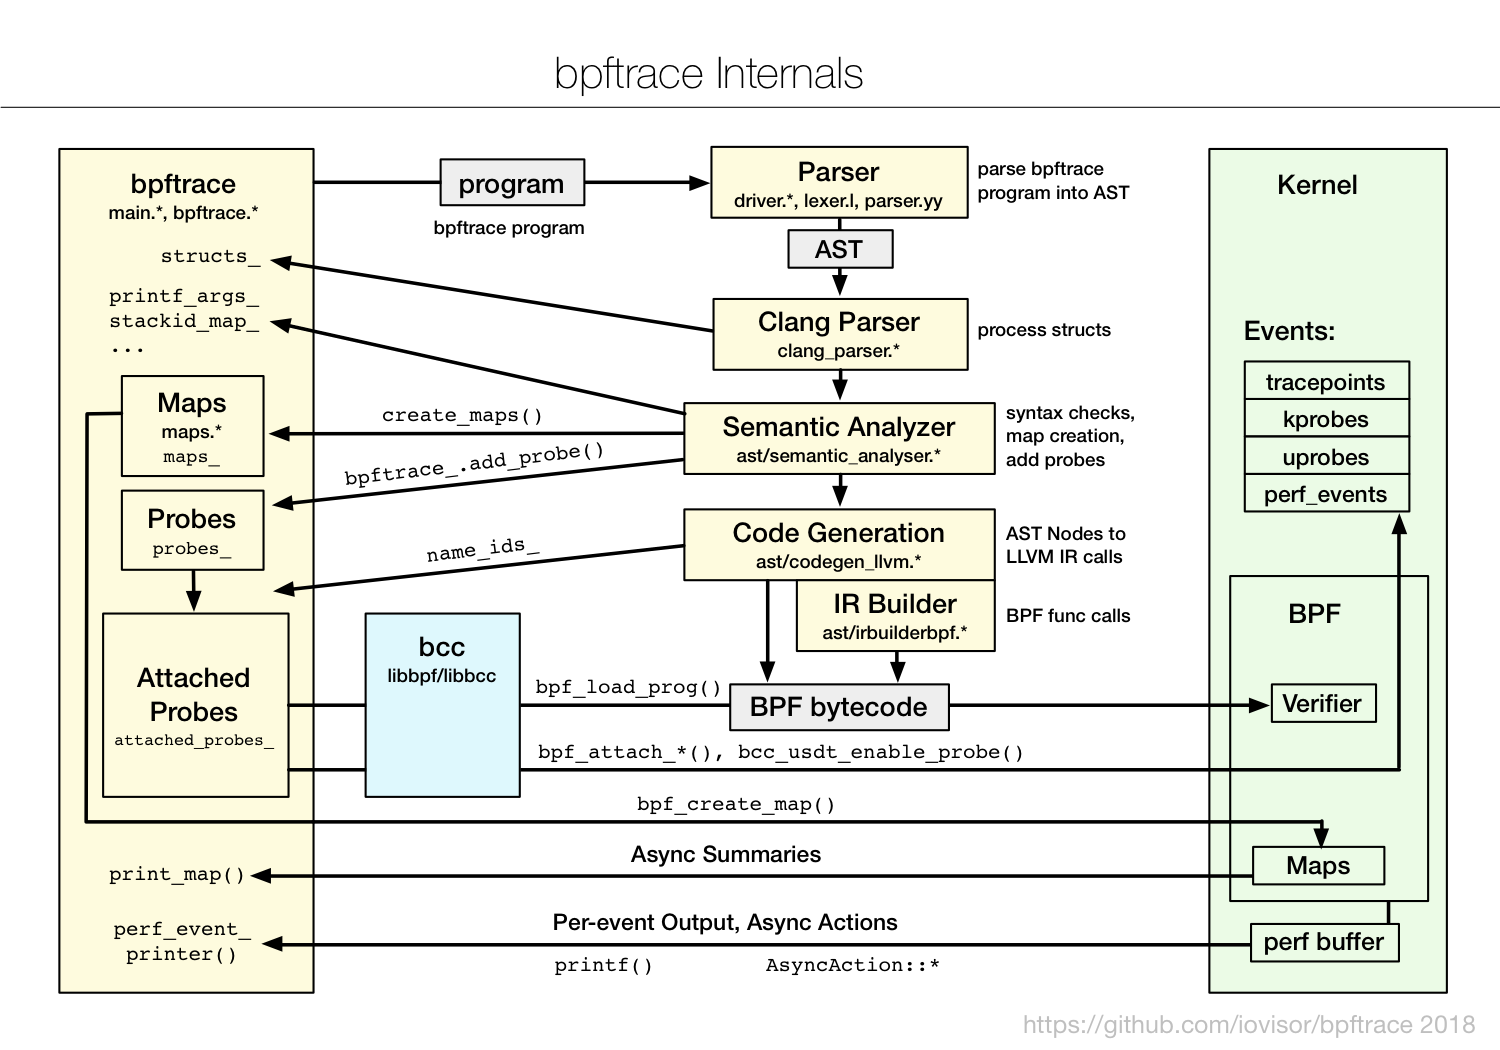
From github High-level tracing language for Linux eBPF
bpftrace employs various techniques for efficiency, minimizing the instrumentation overhead. Summary statistics are stored in kernel BPF maps, which are asynchronously copied from kernel to user-space, only when needed. Other data, and asynchronous actions, are passed from kernel to user-space via the perf output buffer.
As Brendan mentioned in his blog - Linux Extended BPF (eBPF) Tracing Tools
bpftrace is ideal for ad hoc instrumentation with powerful custom one-liners and short scripts, whereas bcc is ideal for complex tools and daemons.
Please refer to Brendan Gregg's Blog- dtrace-for-linux-2018 for a detailed instruction about bpftrace.
USDT
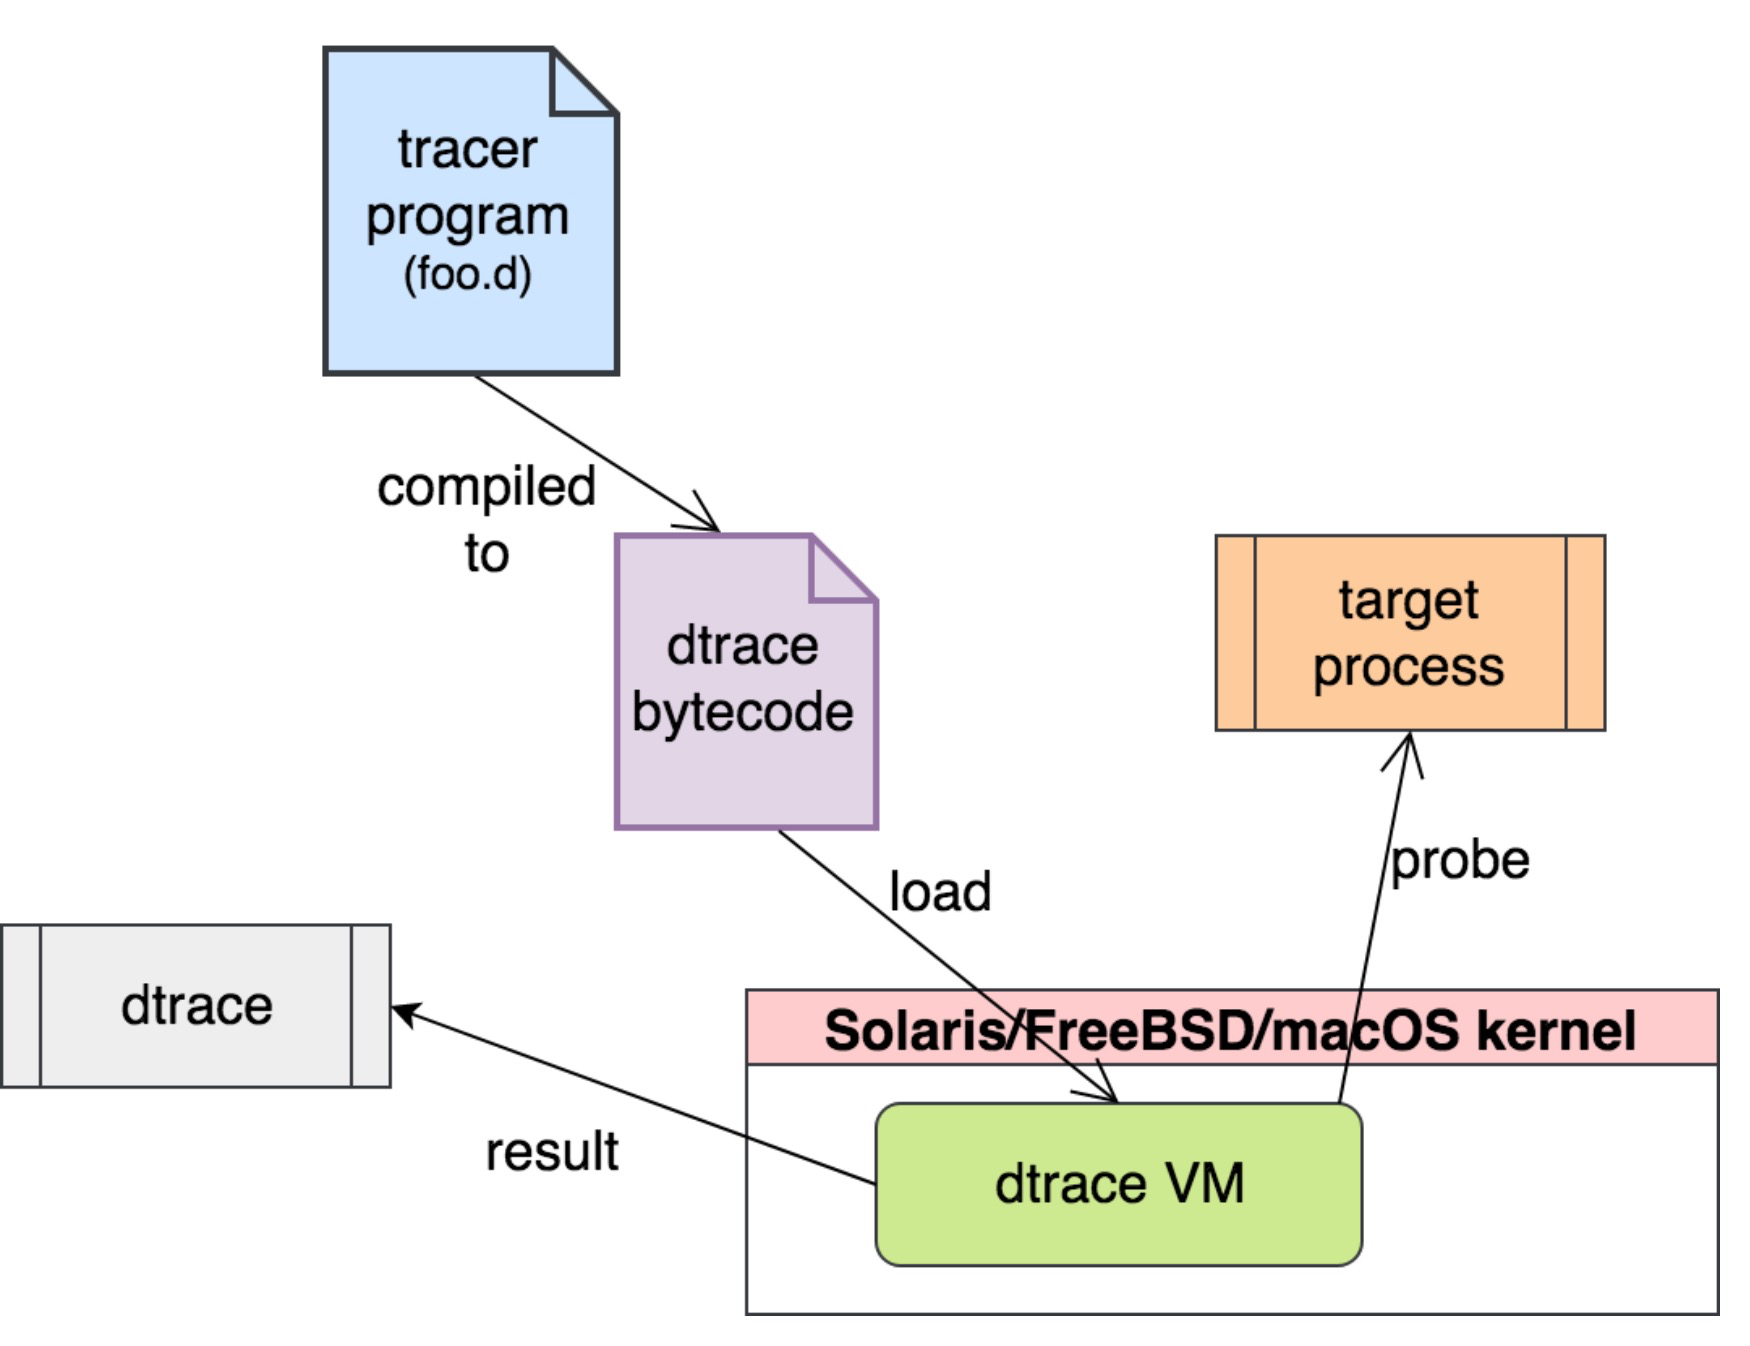
From dtrace blog
USDT (Userland Statically Defined Tracing) is the mechanism by which application developers embed DTrace probes directly into an application. This allows users to trace semantically meaningful operations like “request-start”, rather than having to know which function implements the operation. More importantly, since USDT probes are part of the source code, scripts that use them continue working even as the underlying software evolves and the implementing functions are renamed and deleted.
From LWN doc
The origins of USDT probes can be found in Sun's DTrace utility. While DTrace can't claim to have invented static tracepoints (various implementations are described in the "related work" section of the original DTrace paper), it certainly made them much more popular. With the emergence of DTrace, many applications began adding USDT probes to important functions to aid with tracing and diagnosing run-time behavior. Given that, it's perhaps not surprising that these probes are usually enabled (as part of configuring the build) with the –enable-dtrace switch.
Inside USDT
-
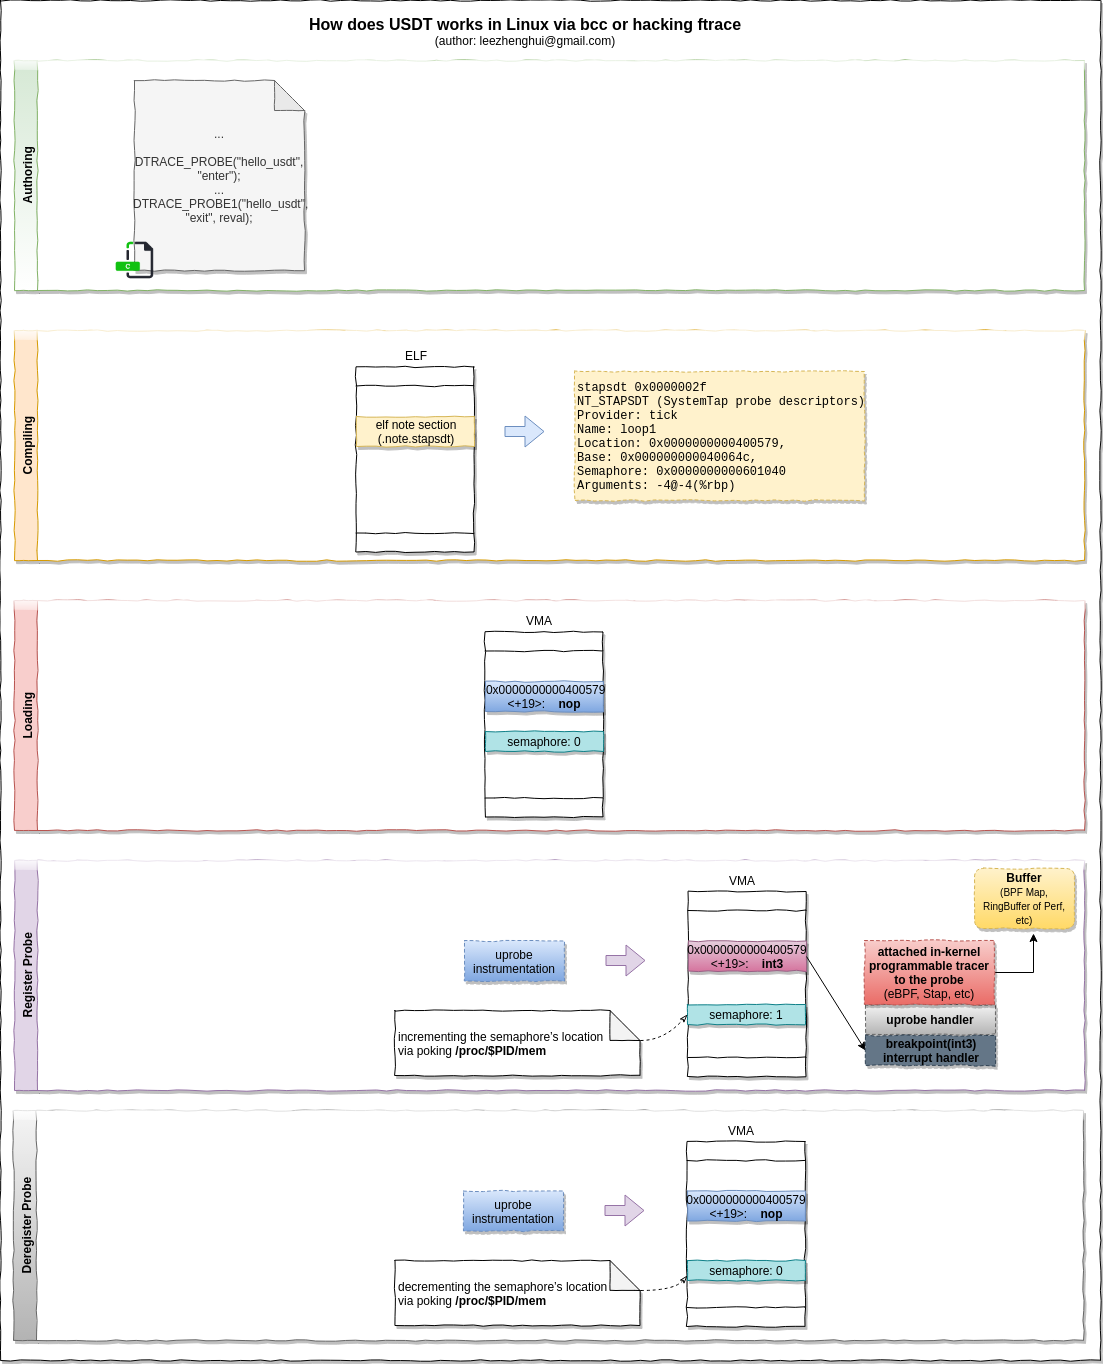
In authoring time, Using macro
DTRACE_PROBE()to delcare a USDT trace point at appropriate souce code location -
During compilation, the source code with USDT trace point will be translated into a
nopinstruction, in the meanwhile, the USDT metadata will be stored in the ELF's.note.stapstdsection. -
When register a probe, USDT tool(usually implemented based on
uprobeunder the hood) will read the ELF.note.stapstdsection, and instrument the instruction fromnoptobreakpoint(int3on x86). In such way, whenever control reaches the marker, the interrupt handler for int3 is called, and by turn the uprobe and attached eBPF program get called in kernel to process the events. If the USDT probe associated with semaphores, the front-ends need to incrementing the semaphore’s location via poking /proc/$PID/mem to enable the probe. -
After deregister the probe, USDT will instrument the instruction from
breakpointback tonop, no event get generated anymore, in the meanwhile, decrementing the semaphore's location to detach the current probe.
Prerequsites(e.g: Ubuntu)
Ubuntu
ubuntu@ubuntu-xenial:~$ uname  -a
Linux ubuntu-xenial 4.10.17-custom #1 SMP Sat Jul 22 14:41:19 UTC 2017 x86_64 x86_64 x86_64 GNU/Linux

ubuntu@ubuntu-xenial:~$ lsb_release -a
No LSB modules are available.
Distributor ID: Ubuntu
Description:    Ubuntu 16.04.2 LTS
Release:        16.04
Codename:       xenial
sudo apt-get install systemtap-sdt-dev
Actually the only thing we can obtain from systemtap-std-dev is
- sys/sdt.h
- dtrace command wrapper (only if you need Semaphore feature)
all of these things can help us genarate expected elf file with markers, that is, generate
nopinstruction in the place where uprobe module can instrument a breakpoint instruction(int3 on x86) when registering a probe, and node section in elf to list these marker locations.
The source code used by this practices:
The compiled executable:
Sample w/o Semaphore support
hello-usdt.c
#include "sys/sdt.h"
int main() {
  DTRACE_PROBE("hello_usdt", "enter");
  int reval = 0;
  DTRACE_PROBE1("hello_usdt", "exit", reval);
}
gcc ./hello-usdt.c -o ./hello-usdt
vagrant@ubuntu-bionic:~/labs/hello-usdt$ readelf  -n ./hello-usdt

Displaying notes found in: .note.ABI-tag
	Owner                 Data size       Description
GNU                  0x00000010       NT_GNU_ABI_TAG (ABI version tag)
	OS: Linux, ABI: 3.2.0

	Displaying notes found in: .note.gnu.build-id
	Owner                 Data size       Description
GNU                  0x00000014       NT_GNU_BUILD_ID (unique build ID bitstring)
	Build ID: e8dcb23707b00c3cd0df7dcb7afd8ce728b6fa5c

	Displaying notes found in: .note.stapsdt
	Owner                 Data size       Description
stapsdt              0x0000002e       NT_STAPSDT (SystemTap probe descriptors)
	Provider: "hello_usdt"
	Name: "enter"
	Location: 0x00000000000005fe, Base: 0x0000000000000694, Semaphore: 0x0000000000000000
	Arguments:
stapsdt              0x00000038       NT_STAPSDT (SystemTap probe descriptors)
	Provider: "hello_usdt"
	Name: "exit"
	Location: 0x0000000000000606, Base: 0x0000000000000694, Semaphore: 0x0000000000000000
	Arguments: -4@-4(%rbp)
Sample w/ Semaphore support
USDT probe can use a semaphore for the implementation of is-enabled: a feature from DTrace where the tracer can inform the target process that a particular event is being traced. The target process can then choose to do some more expensive processing, usually fetching and formatting arguments for a USDT probe.
tp_provider.d
provider hello_semaphore_usdt {
  probe enter();
  probe exit(int exit_code);
}
dtrace -G -s tp_provider.d -o tp_provider.o
dtrace -h -s tp_provider.d -o tp_provider.h
tp_provider.h
/* Generated by the Systemtap dtrace wrapper */

#define _SDT_HAS_SEMAPHORES 1

#define STAP_HAS_SEMAPHORES 1 /* deprecated */

#include <sys/sdt.h>

/* HELLO_SEMAPHORE_USDT_ENTER ( ) */
#if defined STAP_SDT_V1
#define HELLO_SEMAPHORE_USDT_ENTER_ENABLED() __builtin_expect (enter_semaphore, 0)
#define hello_semaphore_usdt_enter_semaphore enter_semaphore
#else
#define HELLO_SEMAPHORE_USDT_ENTER_ENABLED() __builtin_expect (hello_semaphore_usdt_enter_semaphore, 0)
#endif
__extension__ extern unsigned short hello_semaphore_usdt_enter_semaphore __attribute__ ((unused)) __attribute__ ((section (".probes")));
#define HELLO_SEMAPHORE_USDT_ENTER() \
DTRACE_PROBE (hello_semaphore_usdt, enter)

/* HELLO_SEMAPHORE_USDT_EXIT ( int exit_code ) */
#if defined STAP_SDT_V1
#define HELLO_SEMAPHORE_USDT_EXIT_ENABLED() __builtin_expect (exit_semaphore, 0)
#define hello_semaphore_usdt_exit_semaphore exit_semaphore
#else
#define HELLO_SEMAPHORE_USDT_EXIT_ENABLED() __builtin_expect (hello_semaphore_usdt_exit_semaphore, 0)
#endif
__extension__ extern unsigned short hello_semaphore_usdt_exit_semaphore __attribute__ ((unused)) __attribute__ ((section (".probes")));
#define HELLO_SEMAPHORE_USDT_EXIT(arg1) \
DTRACE_PROBE1 (hello_semaphore_usdt, exit, arg1)
hello-semaphore-usdt.c
#include "tp_provider.h"

int main() {
	if (HELLO_SEMAPHORE_USDT_ENTER_ENABLED()) {
		HELLO_SEMAPHORE_USDT_ENTER();
	}
	int reval = 0;
	if (HELLO_SEMAPHORE_USDT_EXIT_ENABLED()) {
		HELLO_SEMAPHORE_USDT_EXIT(reval);
	}
}
gcc -c ./hello-semaphore-usdt.c
gcc -o ./hello-semaphore-usdt ./hello-semaphore-usdt.o ./tp_provider.o
vagrant@ubuntu-bionic:~/labs/hello-semaphore-usdt$ readelf -n ./hello-semaphore-usdt

Displaying notes found in: .note.ABI-tag
	Owner                 Data size       Description
GNU                  0x00000010       NT_GNU_ABI_TAG (ABI version tag)
	OS: Linux, ABI: 3.2.0

	Displaying notes found in: .note.gnu.build-id
	Owner                 Data size       Description
GNU                  0x00000014       NT_GNU_BUILD_ID (unique build ID bitstring)
	Build ID: 323fff32c4a2dd7301a9e3470adcf15ed2fc85bc

	Displaying notes found in: .note.stapsdt
	Owner                 Data size       Description
stapsdt              0x00000034       NT_STAPSDT (SystemTap probe descriptors)
	Provider: hello_semaphore_usdt
	Name: enter
	Location: 0x000000000000060d, Base: 0x00000000000006c4, Semaphore: 0x0000000000201010
	Arguments:
stapsdt              0x0000003e       NT_STAPSDT (SystemTap probe descriptors)
	Provider: hello_semaphore_usdt
	Name: exit
	Location: 0x0000000000000624, Base: 0x00000000000006c4, Semaphore: 0x0000000000201012
	Arguments: -4@-4(%rbp)
Register USDT probe via ftrace(under the hood, ftrace+uprobe)
USDT probes are static tracing markers placed in an executable or library. The probes are just nop instructions emitted by the compiler, whose locations are recorded in the notes section of the ELF binary. Tracing apps can instrument these locations and retrieve probe arguments. Specifically, uprobes (which BPF already supports) can be used to instrument the traced location.
-
On target app side: comipler puts a
nopin the location which use macro and also records the info to elf metadata -
On the tracer side: read the elf and instrument the location via uprobes
-
before run uprobe, we disas the programming as below:
ubuntu@ubuntu-xenial:~/labs/hello-usdt$ gdb ./tick GNU gdb (Ubuntu 7.11.1-0ubuntu1~16.04) 7.11.1 Copyright (C) 2016 Free Software Foundation, Inc. License GPLv3+: GNU GPL version 3 or later <http://gnu.org/licenses/gpl.html> This is free software: you are free to change and redistribute it. There is NO WARRANTY, to the extent permitted by law. Type "show copying" and "show warranty" for details. This GDB was configured as "x86_64-linux-gnu". Type "show configuration" for configuration details. For bug reporting instructions, please see: <http://www.gnu.org/software/gdb/bugs/>. Find the GDB manual and other documentation resources online at: <http://www.gnu.org/software/gdb/documentation/>. For help, type "help". Type "apropos word" to search for commands related to "word"... Reading symbols from ./tick...done. (gdb) disas main Dump of assembler code for function main: 0x0000000000400566 <+0>: push %rbp 0x0000000000400567 <+1>: mov %rsp,%rbp 0x000000000040056a <+4>: sub $0x20,%rsp 0x000000000040056e <+8>: mov %edi,-0x14(%rbp) 0x0000000000400571 <+11>: mov %rsi,-0x20(%rbp) 0x0000000000400575 <+15>: addl $0x1,-0x4(%rbp) 0x0000000000400579 <+19>: nop 0x000000000040057a <+20>: movzwl 0x200ac1(%rip),%eax # 0x601042 <tick_loop2_semaphore> 0x0000000000400581 <+27>: movzwl %ax,%eax 0x0000000000400584 <+30>: test %rax,%rax 0x0000000000400587 <+33>: je 0x40058a <main+36> 0x0000000000400589 <+35>: nop 0x000000000040058a <+36>: mov -0x4(%rbp),%eax 0x000000000040058d <+39>: mov %eax,%esi 0x000000000040058f <+41>: mov $0x400644,%edi 0x0000000000400594 <+46>: mov $0x0,%eax 0x0000000000400599 <+51>: callq 0x400430 <printf@plt> 0x000000000040059e <+56>: mov $0x5,%edi 0x00000000004005a3 <+61>: callq 0x400450 <sleep@plt> 0x00000000004005a8 <+66>: jmp 0x400575 <main+15> End of assembler dump. (gdb) -
Use objdump or /proc/PID/maps to get the
loadaddress:ubuntu@ubuntu-xenial:~/labs/hello-usdt$ objdump -x ./tick | more ./tick: file format elf64-x86-64 ./tick architecture: i386:x86-64, flags 0x00000112: EXEC_P, HAS_SYMS, D_PAGED start address 0x0000000000400470 Program Header: PHDR off 0x0000000000000040 vaddr 0x0000000000400040 paddr 0x0000000000400040 align 2**3 filesz 0x00000000000001f8 memsz 0x00000000000001f8 flags r-x INTERP off 0x0000000000000238 vaddr 0x0000000000400238 paddr 0x0000000000400238 align 2**0 filesz 0x000000000000001c memsz 0x000000000000001c flags r-- LOAD off 0x0000000000000000 vaddr 0x0000000000400000 paddr 0x0000000000400000 align 2**21 filesz 0x00000000000007a4 memsz 0x00000000000007a4 flags r-x LOAD off 0x0000000000000e10 vaddr 0x0000000000600e10 paddr 0x0000000000600e10 align 2**21 So the `0x0000000000400000` is the load addressThe uprobes documentation, uprobetracer.txt, gets this from /proc/PID/maps, however, that technique requires a running process.
-
Get USDT point address
ubuntu@ubuntu-xenial:~/labs/hello-usdt$ readelf -n ./tick Displaying notes found at file offset 0x00000254 with length 0x00000020: Owner Data size Description GNU 0x00000010 NT_GNU_ABI_TAG (ABI version tag) OS: Linux, ABI: 2.6.32 Displaying notes found at file offset 0x00000274 with length 0x00000024: Owner Data size Description GNU 0x00000014 NT_GNU_BUILD_ID (unique build ID bitstring) Build ID: c53d0a44bcfd8bdbce49b926858564a0b473120a Displaying notes found at file offset 0x00001078 with length 0x00000088: Owner Data size Description stapsdt 0x0000002f NT_STAPSDT (SystemTap probe descriptors) Provider: tick Name: loop1 Location: 0x0000000000400579, Base: 0x000000000040064c, Semaphore: 0x0000000000601040 Arguments: -4@-4(%rbp) stapsdt 0x0000002f NT_STAPSDT (SystemTap probe descriptors) Provider: tick Name: loop2 Location: 0x0000000000400589, Base: 0x000000000040064c, Semaphore: 0x0000000000601042 Arguments: -4@-4(%rbp) so we can see the loop1 location is `0x0000000000400579` and loop2 location is `0x0000000000400589` -
Tracking the loop1
sudo /home/ubuntu/perf-tools/bin/uprobe "p:/home/ubuntu/labs/hello-usdt/tick:0x579" -
Check the disas main result:
file:///home/lizh/Desktop/usdt.html ubuntu@ubuntu-xenial:~/labs/hello-usdt$ sudo gdb -p 2581 GNU gdb (Ubuntu 7.11.1-0ubuntu1~16.04) 7.11.1 Copyright (C) 2016 Free Software Foundation, Inc. License GPLv3+: GNU GPL version 3 or later <http://gnu.org/licenses/gpl.html> This is free software: you are free to change and redistribute it. There is NO WARRANTY, to the extent permitted by law. Type "show copying" and "show warranty" for details. This GDB was configured as "x86_64-linux-gnu". Type "show configuration" for configuration details. For bug reporting instructions, please see: <http://www.gnu.org/software/gdb/bugs/>. Find the GDB manual and other documentation resources online at: <http://www.gnu.org/software/gdb/documentation/>. For help, type "help". Type "apropos word" to search for commands related to "word". Attaching to process 2581 Reading symbols from /home/ubuntu/labs/hello-usdt/tick...done. Reading symbols from /lib/x86_64-linux-gnu/libc.so.6...Reading symbols from /usr/lib/debug//lib/x86_64-linux-gnu/libc-2.23.so...done. done. Reading symbols from /lib64/ld-linux-x86-64.so.2...Reading symbols from /usr/lib/debug//lib/x86_64-linux-gnu/ld-2.23.so...done. done. 0x00007f7cec5de2f0 in __nanosleep_nocancel () at ../sysdeps/unix/syscall-template.S:84 84 ../sysdeps/unix/syscall-template.S: No such file or directory. (gdb) disas main Dump of assembler code for function main: 0x0000000000400566 <+0>: push %rbp 0x0000000000400567 <+1>: mov %rsp,%rbp 0x000000000040056a <+4>: sub $0x20,%rsp 0x000000000040056e <+8>: mov %edi,-0x14(%rbp) 0x0000000000400571 <+11>: mov %rsi,-0x20(%rbp) 0x0000000000400575 <+15>: addl $0x1,-0x4(%rbp) 0x0000000000400579 <+19>: int3 0x000000000040057a <+20>: movzwl 0x200ac1(%rip),%eax # 0x601042 <tick_loop2_semaphore> 0x0000000000400581 <+27>: movzwl %ax,%eax 0x0000000000400584 <+30>: test %rax,%rax 0x0000000000400587 <+33>: je 0x40058a <main+36> 0x0000000000400589 <+35>: nop 0x000000000040058a <+36>: mov -0x4(%rbp),%eax 0x000000000040058d <+39>: mov %eax,%esi 0x000000000040058f <+41>: mov $0x400644,%edi 0x0000000000400594 <+46>: mov $0x0,%eax 0x0000000000400599 <+51>: callq 0x400430 <printf@plt> 0x000000000040059e <+56>: mov $0x5,%edi 0x00000000004005a3 <+61>: callq 0x400450 <sleep@plt> 0x00000000004005a8 <+66>: jmp 0x400575 <main+15> End of assembler dump. -
stop tracking, and observe again:
ubuntu@ubuntu-xenial:~/labs/hello-usdt$ sudo gdb -p 2581
GNU gdb (Ubuntu 7.11.1-0ubuntu1~16.04) 7.11.1
Copyright (C) 2016 Free Software Foundation, Inc.
License GPLv3+: GNU GPL version 3 or later <http://gnu.org/licenses/gpl.html>
This is free software: you are free to change and redistribute it.
There is NO WARRANTY, to the extent permitted by law.  Type "show copying"
and "show warranty" for details.
This GDB was configured as "x86_64-linux-gnu".
Type "show configuration" for configuration details.
For bug reporting instructions, please see:
<http://www.gnu.org/software/gdb/bugs/>.
Find the GDB manual and other documentation resources online at:
<http://www.gnu.org/software/gdb/documentation/>.
For help, type "help".
Type "apropos word" to search for commands related to "word".
Attaching to process 2581
Reading symbols from /home/ubuntu/labs/hello-usdt/tick...done.
Reading symbols from /lib/x86_64-linux-gnu/libc.so.6...Reading symbols from /usr/lib/debug//lib/x86_64-linux-gnu/libc-2.23.so...done.
done.
Reading symbols from /lib64/ld-linux-x86-64.so.2...Reading symbols from /usr/lib/debug//lib/x86_64-linux-gnu/ld-2.23.so...done.
done.
0x00007f7cec5de2f0 in __nanosleep_nocancel () at ../sysdeps/unix/syscall-template.S:84
84      ../sysdeps/unix/syscall-template.S: No such file or directory.
(gdb) disas main
Dump of assembler code for function main:
  0x0000000000400566 <+0>:     push   %rbp
  0x0000000000400567 <+1>:     mov    %rsp,%rbp
	0x000000000040056a <+4>:     sub    $0x20,%rsp
	0x000000000040056e <+8>:     mov    %edi,-0x14(%rbp)
	0x0000000000400571 <+11>:    mov    %rsi,-0x20(%rbp)
  0x0000000000400575 <+15>:    addl   $0x1,-0x4(%rbp)
	0x0000000000400579 <+19>:    nop
	0x000000000040057a <+20>:    movzwl 0x200ac1(%rip),%eax        # 0x601042 <tick_loop2_semaphore>
	0x0000000000400581 <+27>:    movzwl %ax,%eax
	0x0000000000400584 <+30>:    test   %rax,%rax
	0x0000000000400587 <+33>:    je     0x40058a <main+36>
	0x0000000000400589 <+35>:    nop
	0x000000000040058a <+36>:    mov    -0x4(%rbp),%eax
	0x000000000040058d <+39>:    mov    %eax,%esi
	0x000000000040058f <+41>:    mov    $0x400644,%edi
	0x0000000000400594 <+46>:    mov    $0x0,%eax
	0x0000000000400599 <+51>:    callq  0x400430 <printf@plt>
	0x000000000040059e <+56>:    mov    $0x5,%edi
	0x00000000004005a3 <+61>:    callq  0x400450 <sleep@plt>
	0x00000000004005a8 <+66>:    jmp    0x400575 <main+15>
	End of assembler dump.
Actually, the better way to do the USDT probe is via bcc or bpftrace frontend tools. I still would like to demonstrate it with a ftrace here, because the hacking steps can show us with more information which can greatly help us understand how USDT works inside. If you are interested in this, please refer to blogs hacking-linux-usdt-ftrace and linux-ftrace-uprobe for more details.
Register USDT probe via bcc(under the hood, eBPF+uprobe)
-
Use bcc tool for the tracking
sudo /usr/share/bcc/tools/trace -p 2581 "u:/home/ubuntu/labs/hello-usdt/tick:loop1" -
The disas main is below:
ubuntu@ubuntu-xenial:~/labs/hello-usdt$ sudo gdb -p 2581 GNU gdb (Ubuntu 7.11.1-0ubuntu1~16.04) 7.11.1 Copyright (C) 2016 Free Software Foundation, Inc. License GPLv3+: GNU GPL version 3 or later <http://gnu.org/licenses/gpl.html> This is free software: you are free to change and redistribute it. There is NO WARRANTY, to the extent permitted by law. Type "show copying" and "show warranty" for details. This GDB was configured as "x86_64-linux-gnu". Type "show configuration" for configuration details. For bug reporting instructions, please see: <http://www.gnu.org/software/gdb/bugs/>. Find the GDB manual and other documentation resources online at: <http://www.gnu.org/software/gdb/documentation/>. For help, type "help". Type "apropos word" to search for commands related to "word". Attaching to process 2581 Reading symbols from /home/ubuntu/labs/hello-usdt/tick...done. Reading symbols from /lib/x86_64-linux-gnu/libc.so.6...Reading symbols from /usr/lib/debug//lib/x86_64-linux-gnu/libc-2.23.so...done. done. Reading symbols from /lib64/ld-linux-x86-64.so.2...Reading symbols from /usr/lib/debug//lib/x86_64-linux-gnu/ld-2.23.so...done. done. 0x00007f7cec5de2f0 in __nanosleep_nocancel () at ../sysdeps/unix/syscall-template.S:84 84 ../sysdeps/unix/syscall-template.S: No such file or directory. (gdb) disas main Dump of assembler code for function main: 0x0000000000400566 <+0>: push %rbp 0x0000000000400567 <+1>: mov %rsp,%rbp 0x000000000040056a <+4>: sub $0x20,%rsp 0x000000000040056e <+8>: mov %edi,-0x14(%rbp) 0x0000000000400571 <+11>: mov %rsi,-0x20(%rbp) 0x0000000000400575 <+15>: addl $0x1,-0x4(%rbp) 0x0000000000400579 <+19>: int3 0x000000000040057a <+20>: movzwl 0x200ac1(%rip),%eax # 0x601042 <tick_loop2_semaphore> 0x0000000000400581 <+27>: movzwl %ax,%eax 0x0000000000400584 <+30>: test %rax,%rax 0x0000000000400587 <+33>: je 0x40058a <main+36> 0x0000000000400589 <+35>: nop 0x000000000040058a <+36>: mov -0x4(%rbp),%eax 0x000000000040058d <+39>: mov %eax,%esi 0x000000000040058f <+41>: mov $0x400644,%edi 0x0000000000400594 <+46>: mov $0x0,%eax 0x0000000000400599 <+51>: callq 0x400430 <printf@plt> 0x000000000040059e <+56>: mov $0x5,%edi 0x00000000004005a3 <+61>: callq 0x400450 <sleep@plt> 0x00000000004005a8 <+66>: jmp 0x400575 <main+15> End of assembler dump. -
Stop BCC tracing, and disas again:
ubuntu@ubuntu-xenial:~/labs/hello-usdt$ sudo gdb -p 2581
GNU gdb (Ubuntu 7.11.1-0ubuntu1~16.04) 7.11.1
Copyright (C) 2016 Free Software Foundation, Inc.
License GPLv3+: GNU GPL version 3 or later <http://gnu.org/licenses/gpl.html>
This is free software: you are free to change and redistribute it.
There is NO WARRANTY, to the extent permitted by law.  Type "show copying"
and "show warranty" for details.
This GDB was configured as "x86_64-linux-gnu".
Type "show configuration" for configuration details.
For bug reporting instructions, please see:
<http://www.gnu.org/software/gdb/bugs/>.
Find the GDB manual and other documentation resources online at:
<http://www.gnu.org/software/gdb/documentation/>.
For help, type "help".
Type "apropos word" to search for commands related to "word".
Attaching to process 2581
Reading symbols from /home/ubuntu/labs/hello-usdt/tick...done.
Reading symbols from /lib/x86_64-linux-gnu/libc.so.6...Reading symbols from /usr/lib/debug//lib/x86_64-linux-gnu/libc-2.23.so...done.
done.
Reading symbols from /lib64/ld-linux-x86-64.so.2...Reading symbols from /usr/lib/debug//lib/x86_64-linux-gnu/ld-2.23.so...done.
done.
0x00007f7cec5de2f0 in __nanosleep_nocancel () at ../sysdeps/unix/syscall-template.S:84
84      ../sysdeps/unix/syscall-template.S: No such file or directory.
(gdb) disas main
Dump of assembler code for function main:
  0x0000000000400566 <+0>:     push   %rbp
  0x0000000000400567 <+1>:     mov    %rsp,%rbp
	0x000000000040056a <+4>:     sub    $0x20,%rsp
	0x000000000040056e <+8>:     mov    %edi,-0x14(%rbp)
	0x0000000000400571 <+11>:    mov    %rsi,-0x20(%rbp)
  0x0000000000400575 <+15>:    addl   $0x1,-0x4(%rbp)
	0x0000000000400579 <+19>:    nop
	0x000000000040057a <+20>:    movzwl 0x200ac1(%rip),%eax        # 0x601042 <tick_loop2_semaphore>
	0x0000000000400581 <+27>:    movzwl %ax,%eax
	0x0000000000400584 <+30>:    test   %rax,%rax
	0x0000000000400587 <+33>:    je     0x40058a <main+36>
	0x0000000000400589 <+35>:    nop
	0x000000000040058a <+36>:    mov    -0x4(%rbp),%eax
	0x000000000040058d <+39>:    mov    %eax,%esi
	0x000000000040058f <+41>:    mov    $0x400644,%edi
	0x0000000000400594 <+46>:    mov    $0x0,%eax
	0x0000000000400599 <+51>:    callq  0x400430 <printf@plt>
	0x000000000040059e <+56>:    mov    $0x5,%edi
	0x00000000004005a3 <+61>:    callq  0x400450 <sleep@plt>
	0x00000000004005a8 <+66>:    jmp    0x400575 <main+15>
	End of assembler dump.
From Brendan Gregg's Blog - Linux bcc/BPF Node.js USDT Tracing
Node.js has built-in USDT (user statically-defined tracing) probes for performance analysis and debugging, bcc provide an example nodejs_http_server.py to demonstrate how to write a bcc script to tracing the USDT events provided by built-in node.js implementation.
Enable USDT Programmatically
USDT implementation allows only statically defined probes because they are set as ELF notes by the compiler. To create probes at runtime, libstapsdt takes advantage of shared libraries: it creates a small library with an ELF note and links it at runtime via dlopen. This way, most existing tools will keep working as expected.
libstapsdt
Under the hood, it works via generating a shared object on-the-fly with USDT
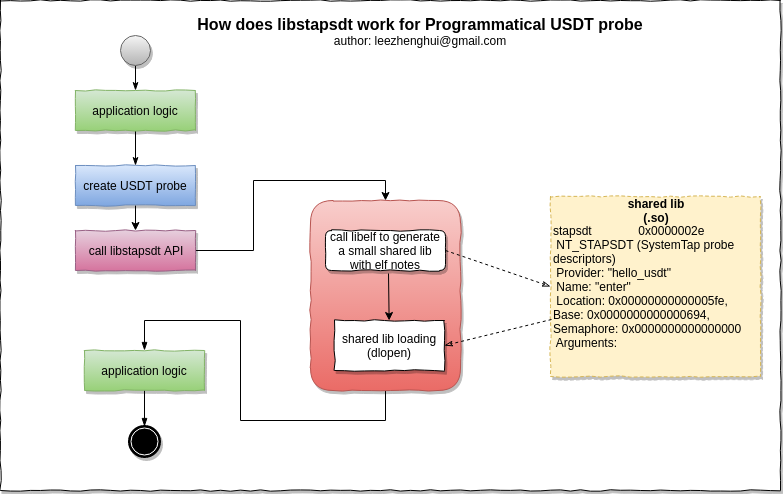
So, let's take a closer look at the demo to understand how it works internally.
vagrant@ubuntu-bionic:~$ sudo more /proc/6951/maps
5624b6129000-5624b612f000 r-xp 00000000 08:01 257506                     /home/vagrant/libstapsdt/demo
5624b632e000-5624b632f000 r--p 00005000 08:01 257506                     /home/vagrant/libstapsdt/demo
5624b632f000-5624b6330000 rw-p 00006000 08:01 257506                     /home/vagrant/libstapsdt/demo
5624b6807000-5624b6828000 rw-p 00000000 00:00 0                          [heap]
7f28ae527000-7f28ae528000 r-xp 00000000 08:01 69383                      /tmp/PROVIDER_NAME-9hrFBV.so
7f28ae528000-7f28ae727000 ---p 00001000 08:01 69383                      /tmp/PROVIDER_NAME-9hrFBV.so
7f28ae727000-7f28ae728000 rw-p 00000000 08:01 69383                      /tmp/PROVIDER_NAME-9hrFBV.so
7f28ae728000-7f28ae744000 r-xp 00000000 08:01 2183                       /lib/x86_64-linux-gnu/libz.so.1.2.11
7f28ae744000-7f28ae943000 ---p 0001c000 08:01 2183                       /lib/x86_64-linux-gnu/libz.so.1.2.11
7f28ae943000-7f28ae944000 r--p 0001b000 08:01 2183                       /lib/x86_64-linux-gnu/libz.so.1.2.11
7f28ae944000-7f28ae945000 rw-p 0001c000 08:01 2183                       /lib/x86_64-linux-gnu/libz.so.1.2.11
7f28ae945000-7f28aeb2c000 r-xp 00000000 08:01 2077                       /lib/x86_64-linux-gnu/libc-2.27.so
7f28aeb2c000-7f28aed2c000 ---p 001e7000 08:01 2077                       /lib/x86_64-linux-gnu/libc-2.27.so
7f28aed2c000-7f28aed30000 r--p 001e7000 08:01 2077                       /lib/x86_64-linux-gnu/libc-2.27.so
7f28aed30000-7f28aed32000 rw-p 001eb000 08:01 2077                       /lib/x86_64-linux-gnu/libc-2.27.so
7f28aed32000-7f28aed36000 rw-p 00000000 00:00 0
7f28aed36000-7f28aed39000 r-xp 00000000 08:01 2080                       /lib/x86_64-linux-gnu/libdl-2.27.so
7f28aed39000-7f28aef38000 ---p 00003000 08:01 2080                       /lib/x86_64-linux-gnu/libdl-2.27.so
7f28aef38000-7f28aef39000 r--p 00002000 08:01 2080                       /lib/x86_64-linux-gnu/libdl-2.27.so
7f28aef39000-7f28aef3a000 rw-p 00003000 08:01 2080                       /lib/x86_64-linux-gnu/libdl-2.27.so
7f28aef3a000-7f28aef53000 r-xp 00000000 08:01 6203                       /usr/lib/x86_64-linux-gnu/libelf-0.170.so
7f28aef53000-7f28af152000 ---p 00019000 08:01 6203                       /usr/lib/x86_64-linux-gnu/libelf-0.170.so
7f28af152000-7f28af153000 r--p 00018000 08:01 6203                       /usr/lib/x86_64-linux-gnu/libelf-0.170.so
7f28af153000-7f28af154000 rw-p 00019000 08:01 6203                       /usr/lib/x86_64-linux-gnu/libelf-0.170.so
7f28af154000-7f28af17b000 r-xp 00000000 08:01 2073                       /lib/x86_64-linux-gnu/ld-2.27.so
7f28af370000-7f28af374000 rw-p 00000000 00:00 0
7f28af37b000-7f28af37c000 r--p 00027000 08:01 2073                       /lib/x86_64-linux-gnu/ld-2.27.so
7f28af37c000-7f28af37d000 rw-p 00028000 08:01 2073                       /lib/x86_64-linux-gnu/ld-2.27.so
7f28af37d000-7f28af37e000 rw-p 00000000 00:00 0
7ffc39c46000-7ffc39c67000 rw-p 00000000 00:00 0                          [stack]
7ffc39ca3000-7ffc39ca6000 r--p 00000000 00:00 0                          [vvar]
7ffc39ca6000-7ffc39ca8000 r-xp 00000000 00:00 0                          [vdso]
ffffffffff600000-ffffffffff601000 r-xp 00000000 00:00 0                  [vsyscall]
Read the elf, we can see the stapsdt section in the dynamical generated so file:
vagrant@ubuntu-bionic:~$ readelf -n /tmp/PROVIDER_NAME-9hrFBV.so

Displaying notes found in: .note.stapsdt
	Owner                 Data size       Description
stapsdt              0x00000040       NT_STAPSDT (SystemTap probe descriptors)
	Provider: PROVIDER_NAME
	Name: PROBE_NAME
	Location: 0x0000000000000260, Base: 0x0000000000000318, Semaphore: 0x0000000000000000
	Arguments: 8@%rdi -8@%rsi
vagrant@ubuntu-bionic:~/bcc$ sudo ./tools/tplist.py  -p 6951
/tmp/PROVIDER_NAME-9hrFBV.so PROVIDER_NAME:PROBE_NAME
/lib/x86_64-linux-gnu/libc-2.27.so libc:setjmp
/lib/x86_64-linux-gnu/libc-2.27.so libc:longjmp
/lib/x86_64-linux-gnu/libc-2.27.so libc:longjmp_target
/lib/x86_64-linux-gnu/libc-2.27.so libc:memory_mallopt_arena_max
/lib/x86_64-linux-gnu/libc-2.27.so libc:memory_mallopt_arena_test
/lib/x86_64-linux-gnu/libc-2.27.so libc:memory_tunable_tcache_max_bytes
/lib/x86_64-linux-gnu/libc-2.27.so libc:memory_tunable_tcache_count
/lib/x86_64-linux-gnu/libc-2.27.so libc:memory_tunable_tcache_unsorted_limit
/lib/x86_64-linux-gnu/libc-2.27.so libc:memory_mallopt_trim_threshold
/lib/x86_64-linux-gnu/libc-2.27.so libc:memory_mallopt_top_pad
/lib/x86_64-linux-gnu/libc-2.27.so libc:memory_mallopt_mmap_threshold
/lib/x86_64-linux-gnu/libc-2.27.so libc:memory_mallopt_mmap_max
/lib/x86_64-linux-gnu/libc-2.27.so libc:memory_mallopt_perturb
/lib/x86_64-linux-gnu/libc-2.27.so libc:memory_heap_new
/lib/x86_64-linux-gnu/libc-2.27.so libc:memory_sbrk_less
/lib/x86_64-linux-gnu/libc-2.27.so libc:memory_arena_reuse
/lib/x86_64-linux-gnu/libc-2.27.so libc:memory_arena_reuse_wait
/lib/x86_64-linux-gnu/libc-2.27.so libc:memory_arena_new
/lib/x86_64-linux-gnu/libc-2.27.so libc:memory_arena_reuse_free_list
/lib/x86_64-linux-gnu/libc-2.27.so libc:memory_arena_retry
/lib/x86_64-linux-gnu/libc-2.27.so libc:memory_heap_free
/lib/x86_64-linux-gnu/libc-2.27.so libc:memory_heap_less
/lib/x86_64-linux-gnu/libc-2.27.so libc:memory_heap_more
/lib/x86_64-linux-gnu/libc-2.27.so libc:memory_sbrk_more
/lib/x86_64-linux-gnu/libc-2.27.so libc:memory_mallopt_free_dyn_thresholds
/lib/x86_64-linux-gnu/libc-2.27.so libc:memory_malloc_retry
/lib/x86_64-linux-gnu/libc-2.27.so libc:memory_memalign_retry
/lib/x86_64-linux-gnu/libc-2.27.so libc:memory_realloc_retry
/lib/x86_64-linux-gnu/libc-2.27.so libc:memory_calloc_retry
/lib/x86_64-linux-gnu/libc-2.27.so libc:memory_mallopt
/lib/x86_64-linux-gnu/libc-2.27.so libc:memory_mallopt_mxfast
/lib/x86_64-linux-gnu/libc-2.27.so libc:lll_lock_wait_private
/lib/x86_64-linux-gnu/ld-2.27.so rtld:init_start
/lib/x86_64-linux-gnu/ld-2.27.so rtld:init_complete
/lib/x86_64-linux-gnu/ld-2.27.so rtld:map_failed
/lib/x86_64-linux-gnu/ld-2.27.so rtld:map_start
/lib/x86_64-linux-gnu/ld-2.27.so rtld:map_complete
/lib/x86_64-linux-gnu/ld-2.27.so rtld:reloc_start
/lib/x86_64-linux-gnu/ld-2.27.so rtld:reloc_complete
/lib/x86_64-linux-gnu/ld-2.27.so rtld:unmap_start
/lib/x86_64-linux-gnu/ld-2.27.so rtld:unmap_complete
/lib/x86_64-linux-gnu/ld-2.27.so rtld:setjmp
/lib/x86_64-linux-gnu/ld-2.27.so rtld:longjmp
/lib/x86_64-linux-gnu/ld-2.27.so rtld:longjmp_target
Adopt USDT probe to interpreter or JIT based languages runtime
libstapsdt is written in C, which makes it very portable to almost any language. Most dynamic languages provide a way to wrap C code.
e.g: node.js wrapper
Example:
const USDT = require("usdt");

const provider = new USDT.USDTProvider("nodeProvider");
const probe1 = provider.addProbe("firstProbe", "int", "char *");
provider.enable();
let countdown = 10;

function waiter() {
	console.log("Firing probe...");
	if(countdown <= 0) {
		console.log("Disable provider");
		provider.disable();
	}
	probe1.fire(function() {
			console.log("Probe fired!");
			countdown = countdown - 1;
			return [countdown, "My little string"];
			});
}

setInterval(waiter, 750);
Run the bcc trace with below command:
sudo ./trace.py -p $(pgrep node) 'u::firstProbe "%d - %s", arg1, arg2'

Output:

PID     TID     COMM            FUNC             -
2255    2255    node            firstProbe       99 - My little string
2255    2255    node            firstProbe       98 - My little string
2255    2255    node            firstProbe       97 - My little string
2255    2255    node            firstProbe       96 - My little string
2255    2255    node            firstProbe       95 - My little string
2255    2255    node            firstProbe       94 - My little string
2255    2255    node            firstProbe       93 - My little string
2255    2255    node            firstProbe       92 - My little string
2255    2255    node            firstProbe       91 - My little string
2255    2255    node            firstProbe       90 - My little string
2255    2255    node            firstProbe       89 - My little string
2255    2255    node            firstProbe       88 - My little string
2255    2255    node            firstProbe       87 - My little string
2255    2255    node            firstProbe       86 - My little string
2255    2255    node            firstProbe       85 - My little string
2255    2255    node            firstProbe       84 - My little string
/proc/$(pgrep node)/maps
22aa4a80000-22aa4b00000 rw-p 00000000 00:00 0
6389d580000-6389d600000 rw-p 00000000 00:00 0
74280e80000-74280f00000 ---p 00000000 00:00 0
a9a83180000-a9a83200000 ---p 00000000 00:00 0
eb584a00000-eb584a80000 ---p 00000000 00:00 0
14cafbcef000-14cafbcf0000 ---p 00000000 00:00 0
14cafbcf0000-14cafbcf8000 rw-p 00000000 00:00 0
14cafbcf8000-14cafbcfb000 ---p 00000000 00:00 0
1778f4f80000-1778f5000000 rw-p 00000000 00:00 0
1b4015200000-1b4015280000 rw-p 00000000 00:00 0
2032e2880000-2032e2900000 rw-p 00000000 00:00 0
24f7e5297000-24f7e5300000 ---p 00000000 00:00 0
24f7e5300000-24f7e5303000 rw-p 00000000 00:00 0
24f7e5303000-24f7e5304000 ---p 00000000 00:00 0
24f7e5304000-24f7e537f000 r-xp 00000000 00:00 0
24f7e537f000-24f7e5380000 ---p 00000000 00:00 0
24f7e5380000-24f7e5383000 rw-p 00000000 00:00 0
24f7e5383000-24f7e5384000 ---p 00000000 00:00 0
24f7e5384000-24f7e53ff000 r-xp 00000000 00:00 0
24f7e53ff000-24f7ed297000 ---p 00000000 00:00 0
2a2dd2000000-2a2dd2080000 ---p 00000000 00:00 0
2a63e3f00000-2a63e3f80000 rw-p 00000000 00:00 0
2e846de80000-2e846de83000 rw-p 00000000 00:00 0
2f0322200000-2f0322280000 rw-p 00000000 00:00 0
30706a880000-30706a900000 ---p 00000000 00:00 0
33080e980000-33080ea00000 rw-p 00000000 00:00 0
3574daf80000-3574dafb9000 rw-p 00000000 00:00 0
359866800000-359866880000 rw-p 00000000 00:00 0
37e7b1200000-37e7b1203000 rw-p 00000000 00:00 0
37e7b1203000-37e7b1280000 r--p 00000000 00:00 0
3dca47980000-3dca47a00000 ---p 00000000 00:00 0
55e9b0709000-55e9b272a000 r-xp 00000000 08:01 63273                      /usr/local/bin/node
55e9b292a000-55e9b29bb000 r--p 02021000 08:01 63273                      /usr/local/bin/node
55e9b29bb000-55e9b29d1000 rw-p 020b2000 08:01 63273                      /usr/local/bin/node
55e9b29d1000-55e9b29eb000 rw-p 00000000 00:00 0
55e9b469c000-55e9b4796000 rw-p 00000000 00:00 0                          [heap]
7fc9ac000000-7fc9ac021000 rw-p 00000000 00:00 0
7fc9ac021000-7fc9b0000000 ---p 00000000 00:00 0
7fc9b0000000-7fc9b0021000 rw-p 00000000 00:00 0
7fc9b0021000-7fc9b4000000 ---p 00000000 00:00 0
7fc9b4000000-7fc9b4021000 rw-p 00000000 00:00 0
7fc9b4021000-7fc9b8000000 ---p 00000000 00:00 0
7fc9b8000000-7fc9b8021000 rw-p 00000000 00:00 0
7fc9b8021000-7fc9bc000000 ---p 00000000 00:00 0
7fc9bc000000-7fc9bc021000 rw-p 00000000 00:00 0
7fc9bc021000-7fc9c0000000 ---p 00000000 00:00 0
7fc9c0bca000-7fc9c0bcb000 r-xp 00000000 08:01 99                         /tmp/nodeProvider-BG8PLL.so
7fc9c0bcb000-7fc9c0dca000 ---p 00001000 08:01 99                         /tmp/nodeProvider-BG8PLL.so
7fc9c0dca000-7fc9c0dcb000 rw-p 00000000 08:01 99                         /tmp/nodeProvider-BG8PLL.so
7fc9c0dcb000-7fc9c0de7000 r-xp 00000000 08:01 2183                       /lib/x86_64-linux-gnu/libz.so.1.2.11
7fc9c0de7000-7fc9c0fe6000 ---p 0001c000 08:01 2183                       /lib/x86_64-linux-gnu/libz.so.1.2.11
7fc9c0fe6000-7fc9c0fe7000 r--p 0001b000 08:01 2183                       /lib/x86_64-linux-gnu/libz.so.1.2.11
7fc9c0fe7000-7fc9c0fe8000 rw-p 0001c000 08:01 2183                       /lib/x86_64-linux-gnu/libz.so.1.2.11
7fc9c0fe8000-7fc9c1001000 r-xp 00000000 08:01 6203                       /usr/lib/x86_64-linux-gnu/libelf-0.170.so
7fc9c1001000-7fc9c1200000 ---p 00019000 08:01 6203                       /usr/lib/x86_64-linux-gnu/libelf-0.170.so
7fc9c1200000-7fc9c1201000 r--p 00018000 08:01 6203                       /usr/lib/x86_64-linux-gnu/libelf-0.170.so
7fc9c1201000-7fc9c1202000 rw-p 00019000 08:01 6203                       /usr/lib/x86_64-linux-gnu/libelf-0.170.so
7fc9c1202000-7fc9c1208000 r-xp 00000000 08:01 62807                      /usr/lib/libstapsdt.so.0
7fc9c1208000-7fc9c1407000 ---p 00006000 08:01 62807                      /usr/lib/libstapsdt.so.0
7fc9c1407000-7fc9c1408000 r--p 00005000 08:01 62807                      /usr/lib/libstapsdt.so.0
7fc9c1408000-7fc9c1409000 rw-p 00006000 08:01 62807                      /usr/lib/libstapsdt.so.0
7fc9c1409000-7fc9c1410000 r-xp 00000000 08:01 555899                     /home/vagrant/labs/hello-nodejs-usdt/node_modules/usdt/build/Release/usdt.node
7fc9c1410000-7fc9c160f000 ---p 00007000 08:01 555899                     /home/vagrant/labs/hello-nodejs-usdt/node_modules/usdt/build/Release/usdt.node
7fc9c160f000-7fc9c1610000 r--p 00006000 08:01 555899                     /home/vagrant/labs/hello-nodejs-usdt/node_modules/usdt/build/Release/usdt.node
7fc9c1610000-7fc9c1611000 rw-p 00007000 08:01 555899                     /home/vagrant/labs/hello-nodejs-usdt/node_modules/usdt/build/Release/usdt.node
7fc9c1611000-7fc9c1612000 ---p 00000000 00:00 0
7fc9c1612000-7fc9c1e12000 rw-p 00000000 00:00 0
7fc9c1e12000-7fc9c1e13000 ---p 00000000 00:00 0
7fc9c1e13000-7fc9c2613000 rw-p 00000000 00:00 0
7fc9c2613000-7fc9c2614000 ---p 00000000 00:00 0
7fc9c2614000-7fc9c2e14000 rw-p 00000000 00:00 0
7fc9c2e14000-7fc9c2e15000 ---p 00000000 00:00 0
7fc9c2e15000-7fc9c3615000 rw-p 00000000 00:00 0
7fc9c3615000-7fc9c3616000 ---p 00000000 00:00 0
7fc9c3616000-7fc9c3e16000 rw-p 00000000 00:00 0
7fc9c3e16000-7fc9c3ffd000 r-xp 00000000 08:01 2077                       /lib/x86_64-linux-gnu/libc-2.27.so
7fc9c3ffd000-7fc9c41fd000 ---p 001e7000 08:01 2077                       /lib/x86_64-linux-gnu/libc-2.27.so
7fc9c41fd000-7fc9c4201000 r--p 001e7000 08:01 2077                       /lib/x86_64-linux-gnu/libc-2.27.so
7fc9c4201000-7fc9c4203000 rw-p 001eb000 08:01 2077                       /lib/x86_64-linux-gnu/libc-2.27.so
7fc9c4203000-7fc9c4207000 rw-p 00000000 00:00 0
7fc9c4207000-7fc9c4221000 r-xp 00000000 08:01 2178                       /lib/x86_64-linux-gnu/libpthread-2.27.so
7fc9c4221000-7fc9c4420000 ---p 0001a000 08:01 2178                       /lib/x86_64-linux-gnu/libpthread-2.27.so
7fc9c4420000-7fc9c4421000 r--p 00019000 08:01 2178                       /lib/x86_64-linux-gnu/libpthread-2.27.so
7fc9c4421000-7fc9c4422000 rw-p 0001a000 08:01 2178                       /lib/x86_64-linux-gnu/libpthread-2.27.so
7fc9c4422000-7fc9c4426000 rw-p 00000000 00:00 0
7fc9c4426000-7fc9c443d000 r-xp 00000000 08:01 2090                       /lib/x86_64-linux-gnu/libgcc_s.so.1
7fc9c443d000-7fc9c463c000 ---p 00017000 08:01 2090                       /lib/x86_64-linux-gnu/libgcc_s.so.1
7fc9c463c000-7fc9c463d000 r--p 00016000 08:01 2090                       /lib/x86_64-linux-gnu/libgcc_s.so.1
7fc9c463d000-7fc9c463e000 rw-p 00017000 08:01 2090                       /lib/x86_64-linux-gnu/libgcc_s.so.1
7fc9c463e000-7fc9c47db000 r-xp 00000000 08:01 2081                       /lib/x86_64-linux-gnu/libm-2.27.so
7fc9c47db000-7fc9c49da000 ---p 0019d000 08:01 2081                       /lib/x86_64-linux-gnu/libm-2.27.so
7fc9c49da000-7fc9c49db000 r--p 0019c000 08:01 2081                       /lib/x86_64-linux-gnu/libm-2.27.so
7fc9c49db000-7fc9c49dc000 rw-p 0019d000 08:01 2081                       /lib/x86_64-linux-gnu/libm-2.27.so
7fc9c49dc000-7fc9c4b55000 r-xp 00000000 08:01 5028                       /usr/lib/x86_64-linux-gnu/libstdc++.so.6.0.25
7fc9c4b55000-7fc9c4d55000 ---p 00179000 08:01 5028                       /usr/lib/x86_64-linux-gnu/libstdc++.so.6.0.25
7fc9c4d55000-7fc9c4d5f000 r--p 00179000 08:01 5028                       /usr/lib/x86_64-linux-gnu/libstdc++.so.6.0.25
7fc9c4d5f000-7fc9c4d61000 rw-p 00183000 08:01 5028                       /usr/lib/x86_64-linux-gnu/libstdc++.so.6.0.25
7fc9c4d61000-7fc9c4d65000 rw-p 00000000 00:00 0
7fc9c4d65000-7fc9c4d6c000 r-xp 00000000 08:01 2180                       /lib/x86_64-linux-gnu/librt-2.27.so
7fc9c4d6c000-7fc9c4f6b000 ---p 00007000 08:01 2180                       /lib/x86_64-linux-gnu/librt-2.27.so
7fc9c4f6b000-7fc9c4f6c000 r--p 00006000 08:01 2180                       /lib/x86_64-linux-gnu/librt-2.27.so
7fc9c4f6c000-7fc9c4f6d000 rw-p 00007000 08:01 2180                       /lib/x86_64-linux-gnu/librt-2.27.so
7fc9c4f6d000-7fc9c4f70000 r-xp 00000000 08:01 2080                       /lib/x86_64-linux-gnu/libdl-2.27.so
7fc9c4f70000-7fc9c516f000 ---p 00003000 08:01 2080                       /lib/x86_64-linux-gnu/libdl-2.27.so
7fc9c516f000-7fc9c5170000 r--p 00002000 08:01 2080                       /lib/x86_64-linux-gnu/libdl-2.27.so
7fc9c5170000-7fc9c5171000 rw-p 00003000 08:01 2080                       /lib/x86_64-linux-gnu/libdl-2.27.so
7fc9c5171000-7fc9c5198000 r-xp 00000000 08:01 2073                       /lib/x86_64-linux-gnu/ld-2.27.so
7fc9c5389000-7fc9c5390000 rw-p 00000000 00:00 0
7fc9c5393000-7fc9c5394000 ---p 00000000 00:00 0
7fc9c5394000-7fc9c5398000 rw-p 00000000 00:00 0
7fc9c5398000-7fc9c5399000 r--p 00027000 08:01 2073                       /lib/x86_64-linux-gnu/ld-2.27.so
7fc9c5399000-7fc9c539a000 rw-p 00028000 08:01 2073                       /lib/x86_64-linux-gnu/ld-2.27.so
7fc9c539a000-7fc9c539b000 rw-p 00000000 00:00 0
7ffcc59d5000-7ffcc59f6000 rw-p 00000000 00:00 0                          [stack]
7ffcc59f9000-7ffcc59fc000 r--p 00000000 00:00 0                          [vvar]
7ffcc59fc000-7ffcc59fe000 r-xp 00000000 00:00 0                          [vdso]
ffffffffff600000-ffffffffff601000 r-xp 00000000 00:00 0                  [vsyscall]
readelf
vagrant@ubuntu-bionic:~$ readelf -n /tmp/nodeProvider-BG8PLL.so

Displaying notes found in: .note.stapsdt
	Owner                 Data size       Description
stapsdt              0x0000003f       NT_STAPSDT (SystemTap probe descriptors)
	Provider: nodeProvider
	Name: firstProbe
	Location: 0x0000000000000260, Base: 0x0000000000000318, Semaphore: 0x0000000000000000
	Arguments: -4@%rdi 8@%rsi
tplist
sudo ./tools/tplist.py  -p 2836

/tmp/nodeProvider-BG8PLL.so nodeProvider:firstProbe
/lib/x86_64-linux-gnu/libc-2.27.so libc:setjmp
/lib/x86_64-linux-gnu/libc-2.27.so libc:longjmp
/lib/x86_64-linux-gnu/libc-2.27.so libc:longjmp_target
/lib/x86_64-linux-gnu/libc-2.27.so libc:memory_mallopt_arena_max
/lib/x86_64-linux-gnu/libc-2.27.so libc:memory_mallopt_arena_test
/lib/x86_64-linux-gnu/libc-2.27.so libc:memory_tunable_tcache_max_bytes
/lib/x86_64-linux-gnu/libc-2.27.so libc:memory_tunable_tcache_count
/lib/x86_64-linux-gnu/libc-2.27.so libc:memory_tunable_tcache_unsorted_limit
/lib/x86_64-linux-gnu/libc-2.27.so libc:memory_mallopt_trim_threshold
/lib/x86_64-linux-gnu/libc-2.27.so libc:memory_mallopt_top_pad
/lib/x86_64-linux-gnu/libc-2.27.so libc:memory_mallopt_mmap_threshold
/lib/x86_64-linux-gnu/libc-2.27.so libc:memory_mallopt_mmap_max
/lib/x86_64-linux-gnu/libc-2.27.so libc:memory_mallopt_perturb
/lib/x86_64-linux-gnu/libc-2.27.so libc:memory_heap_new
/lib/x86_64-linux-gnu/libc-2.27.so libc:memory_sbrk_less
/lib/x86_64-linux-gnu/libc-2.27.so libc:memory_arena_reuse
/lib/x86_64-linux-gnu/libc-2.27.so libc:memory_arena_reuse_wait
/lib/x86_64-linux-gnu/libc-2.27.so libc:memory_arena_new
/lib/x86_64-linux-gnu/libc-2.27.so libc:memory_arena_reuse_free_list
/lib/x86_64-linux-gnu/libc-2.27.so libc:memory_arena_retry
/lib/x86_64-linux-gnu/libc-2.27.so libc:memory_heap_free
/lib/x86_64-linux-gnu/libc-2.27.so libc:memory_heap_less
/lib/x86_64-linux-gnu/libc-2.27.so libc:memory_heap_more
/lib/x86_64-linux-gnu/libc-2.27.so libc:memory_sbrk_more
/lib/x86_64-linux-gnu/libc-2.27.so libc:memory_mallopt_free_dyn_thresholds
/lib/x86_64-linux-gnu/libc-2.27.so libc:memory_malloc_retry
/lib/x86_64-linux-gnu/libc-2.27.so libc:memory_memalign_retry
/lib/x86_64-linux-gnu/libc-2.27.so libc:memory_realloc_retry
/lib/x86_64-linux-gnu/libc-2.27.so libc:memory_calloc_retry
/lib/x86_64-linux-gnu/libc-2.27.so libc:memory_mallopt
/lib/x86_64-linux-gnu/libc-2.27.so libc:memory_mallopt_mxfast
/lib/x86_64-linux-gnu/libc-2.27.so libc:lll_lock_wait_private
/lib/x86_64-linux-gnu/libpthread-2.27.so libpthread:pthread_start
/lib/x86_64-linux-gnu/libpthread-2.27.so libpthread:pthread_create
/lib/x86_64-linux-gnu/libpthread-2.27.so libpthread:pthread_join
/lib/x86_64-linux-gnu/libpthread-2.27.so libpthread:pthread_join_ret
/lib/x86_64-linux-gnu/libpthread-2.27.so libpthread:mutex_init
/lib/x86_64-linux-gnu/libpthread-2.27.so libpthread:mutex_destroy
/lib/x86_64-linux-gnu/libpthread-2.27.so libpthread:mutex_acquired
/lib/x86_64-linux-gnu/libpthread-2.27.so libpthread:mutex_entry
/lib/x86_64-linux-gnu/libpthread-2.27.so libpthread:mutex_timedlock_entry
/lib/x86_64-linux-gnu/libpthread-2.27.so libpthread:mutex_timedlock_acquired
/lib/x86_64-linux-gnu/libpthread-2.27.so libpthread:mutex_release
/lib/x86_64-linux-gnu/libpthread-2.27.so libpthread:rwlock_destroy
/lib/x86_64-linux-gnu/libpthread-2.27.so libpthread:rdlock_entry
/lib/x86_64-linux-gnu/libpthread-2.27.so libpthread:rdlock_acquire_read
/lib/x86_64-linux-gnu/libpthread-2.27.so libpthread:wrlock_entry
/lib/x86_64-linux-gnu/libpthread-2.27.so libpthread:wrlock_acquire_write
/lib/x86_64-linux-gnu/libpthread-2.27.so libpthread:rwlock_unlock
/lib/x86_64-linux-gnu/libpthread-2.27.so libpthread:cond_init
/lib/x86_64-linux-gnu/libpthread-2.27.so libpthread:cond_destroy
/lib/x86_64-linux-gnu/libpthread-2.27.so libpthread:cond_wait
/lib/x86_64-linux-gnu/libpthread-2.27.so libpthread:cond_signal
/lib/x86_64-linux-gnu/libpthread-2.27.so libpthread:cond_broadcast
/lib/x86_64-linux-gnu/libpthread-2.27.so libpthread:lll_lock_wait_private
/lib/x86_64-linux-gnu/libpthread-2.27.so libpthread:lll_lock_wait
/lib/x86_64-linux-gnu/libm-2.27.so libm:slowatan2
/lib/x86_64-linux-gnu/libm-2.27.so libm:slowatan2_inexact
/lib/x86_64-linux-gnu/libm-2.27.so libm:slowlog_inexact
/lib/x86_64-linux-gnu/libm-2.27.so libm:slowlog
/lib/x86_64-linux-gnu/libm-2.27.so libm:slowatan_inexact
/lib/x86_64-linux-gnu/libm-2.27.so libm:slowatan
/lib/x86_64-linux-gnu/libm-2.27.so libm:slowtan
/lib/x86_64-linux-gnu/libm-2.27.so libm:slowasin
/lib/x86_64-linux-gnu/libm-2.27.so libm:slowacos
/lib/x86_64-linux-gnu/libm-2.27.so libm:slowsin
/lib/x86_64-linux-gnu/libm-2.27.so libm:slowcos
/lib/x86_64-linux-gnu/libm-2.27.so libm:slowexp_p6
/lib/x86_64-linux-gnu/libm-2.27.so libm:slowexp_p32
/lib/x86_64-linux-gnu/libm-2.27.so libm:slowpow_p10
/lib/x86_64-linux-gnu/libm-2.27.so libm:slowpow_p32
/usr/lib/x86_64-linux-gnu/libstdc++.so.6.0.25 libstdcxx:catch
/usr/lib/x86_64-linux-gnu/libstdc++.so.6.0.25 libstdcxx:throw
/usr/lib/x86_64-linux-gnu/libstdc++.so.6.0.25 libstdcxx:rethrow
/lib/x86_64-linux-gnu/ld-2.27.so rtld:init_start
/lib/x86_64-linux-gnu/ld-2.27.so rtld:init_complete
/lib/x86_64-linux-gnu/ld-2.27.so rtld:map_failed
/lib/x86_64-linux-gnu/ld-2.27.so rtld:map_start
/lib/x86_64-linux-gnu/ld-2.27.so rtld:map_complete
/lib/x86_64-linux-gnu/ld-2.27.so rtld:reloc_start
/lib/x86_64-linux-gnu/ld-2.27.so rtld:reloc_complete
/lib/x86_64-linux-gnu/ld-2.27.so rtld:unmap_start
/lib/x86_64-linux-gnu/ld-2.27.so rtld:unmap_complete
/lib/x86_64-linux-gnu/ld-2.27.so rtld:setjmp
/lib/x86_64-linux-gnu/ld-2.27.so rtld:longjmp
/lib/x86_64-linux-gnu/ld-2.27.so rtld:longjmp_target
Wrapping up
In this post, we covered below contents which related to in linux tracing
-
Basic concepts of Linux tracing
-
Linux tracing stack, including: event sources, tracing framework and frontends
-
USDT
-
Programmatically enabled USDT probe
Brendan Gregg's Blog provide a lots of awesome topics regarding linux tracing, if you want an in-depth/thoroughly learning about linux tracing, that is the best place to subscribe.
Appendix
perf_event in practice
-
uprobe:
# perf probe -x /bin/bash 'readline%return +0($retval):string' Added new event: probe_bash:readline (on readline%return in /bin/bash with +0($retval):string) You can now use it in all perf tools, such as: perf record -e probe_bash:readline -aR sleep 1 # perf record -e probe_bash:readline -a ^C[ perf record: Woken up 1 times to write data ] [ perf record: Captured and wrote 0.259 MB perf.data (2 samples) ] # perf script bash 26239 [003] 283194.152199: probe_bash:readline: (48db60 <- 41e876) arg1="ls -l" bash 26239 [003] 283195.016155: probe_bash:readline: (48db60 <- 41e876) arg1="date" # perf probe --del probe_bash:readline Removed event: probe_bash:readline -
Static User Tracing:
# perf buildid-cache --add `which node` # perf list | grep sdt_node sdt_node:gc__done [SDT event] sdt_node:gc__start [SDT event] sdt_node:http__client__request [SDT event] sdt_node:http__client__response [SDT event] sdt_node:http__server__request [SDT event] sdt_node:http__server__response [SDT event] sdt_node:net__server__connection [SDT event] sdt_node:net__stream__end [SDT event] # perf record -e sdt_node:http__server__request -a ^C[ perf record: Woken up 1 times to write data ] [ perf record: Captured and wrote 0.446 MB perf.data (3 samples) ] # perf script node 7646 [002] 361.012364: sdt_node:http__server__request: (dc2e69) node 7646 [002] 361.204718: sdt_node:http__server__request: (dc2e69) node 7646 [002] 361.363043: sdt_node:http__server__request: (dc2e69) -
Dynamic Kernel Tracing: .e.g:
# perf probe --add tcp_sendmsg
Failed to find path of kernel module.
Added new event:
probe:tcp_sendmsg    (on tcp_sendmsg)

You can now use it in all perf tools, such as:

perf record -e probe:tcp_sendmsg -aR sleep 1
# perf record -e probe:tcp_sendmsg -a -g -- sleep 5 [ perf record: Woken up 1 times to write data ] [ perf record: Captured and wrote 0.228 MB perf.data (~9974 samples) ]# perf report --stdio # ======== # captured on: Fri Jan 31 20:10:14 2014 # hostname : pgbackup # os release : 3.9.3-ubuntu-12-opt # perf version : 3.9.3 # arch : x86_64 # nrcpus online : 8 # nrcpus avail : 8 # cpudesc : Intel(R) Xeon(R) CPU E5-2670 0 @ 2.60GHz # cpuid : GenuineIntel,6,45,7 # total memory : 8179104 kB # cmdline : /lib/modules/3.9.3/build/tools/perf/perf record -e probe:tcp_sendmsg -a -g -- sleep 5 # event : name = probe:tcp_sendmsg, type = 2, config = 0x3b2, config1 = 0x0, config2 = 0x0, ... # HEADER_CPU_TOPOLOGY info available, use -I to display # HEADER_NUMA_TOPOLOGY info available, use -I to display # pmu mappings: software = 1, tracepoint = 2, breakpoint = 5 # ======== # # Samples: 12 of event 'probe:tcp_sendmsg' # Event count (approx.): 12 # # Overhead Command Shared Object Symbol # ........ ....... ................. ............... # 100.00% sshd [kernel.kallsyms] [k] tcp_sendmsg | --- tcp_sendmsg sock_aio_write do_sync_write vfs_write sys_write system_call_fastpath __write_nocancel | |--8.33%-- 0x50f00000001b810 --91.67%-- [...] -
Dynamic User-Level Tracing:
# perf probe -x /lib/x86_64-linux-gnu/libc-2.15.so --add malloc
Added new event:
probe_libc:malloc    (on 0x82f20)

You can now use it in all perf tools, such as:

perf record -e probe_libc:malloc -aR sleep 1
# perf record -e probe_libc:malloc -a ^C[ perf record: Woken up 12 times to write data ] [ perf record: Captured and wrote 3.522 MB perf.data (~153866 samples) ]# perf report -n [...] # Samples: 45K of event 'probe_libc:malloc' # Event count (approx.): 45158 # # Overhead Samples Command Shared Object Symbol # ........ ............ ............... ............. .......... # 42.72% 19292 apt-config libc-2.15.so [.] malloc 19.71% 8902 grep libc-2.15.so [.] malloc 7.88% 3557 sshd libc-2.15.so [.] malloc 6.25% 2824 sed libc-2.15.so [.] malloc 6.06% 2738 which libc-2.15.so [.] malloc 4.12% 1862 update-motd-upd libc-2.15.so [.] malloc 3.72% 1680 stat libc-2.15.so [.] malloc 1.68% 758 login libc-2.15.so [.] malloc 1.21% 546 run-parts libc-2.15.so [.] malloc 1.21% 545 ls libc-2.15.so [.] malloc 0.80% 360 dircolors libc-2.15.so [.] malloc 0.56% 252 tr libc-2.15.so [.] malloc 0.54% 242 top libc-2.15.so [.] malloc 0.49% 222 irqbalance libc-2.15.so [.] malloc 0.44% 200 dpkg libc-2.15.so [.] malloc 0.38% 173 lesspipe libc-2.15.so [.] malloc 0.29% 130 update-motd-fsc libc-2.15.so [.] malloc 0.25% 112 uname libc-2.15.so [.] malloc 0.24% 108 cut libc-2.15.so [.] malloc 0.23% 104 groups libc-2.15.so [.] malloc 0.21% 94 release-upgrade libc-2.15.so [.] malloc 0.18% 82 00-header libc-2.15.so [.] malloc 0.14% 62 mesg libc-2.15.so [.] malloc 0.09% 42 update-motd-reb libc-2.15.so [.] malloc 0.09% 40 date libc-2.15.so [.] malloc 0.08% 35 bash libc-2.15.so [.] malloc 0.08% 35 basename libc-2.15.so [.] malloc 0.08% 34 dirname libc-2.15.so [.] malloc 0.06% 29 sh libc-2.15.so [.] malloc 0.06% 26 99-footer libc-2.15.so [.] malloc 0.05% 24 cat libc-2.15.so [.] malloc 0.04% 18 expr libc-2.15.so [.] malloc 0.04% 17 rsyslogd libc-2.15.so [.] malloc 0.03% 12 stty libc-2.15.so [.] malloc 0.00% 1 cron libc-2.15.so [.] malloc
perf_tools
perf_tools tech-stack
from mmi.hatenablog.com
sample of uprobe via ftrace
Following example shows how to dump the instruction pointer and %ax register at the probed text address. Probe zfree function in /bin/zsh:
# cd /sys/kernel/debug/tracing/
# cat /proc/`pgrep zsh`/maps | grep /bin/zsh | grep r-xp
00400000-0048a000 r-xp 00000000 08:03 130904 /bin/zsh
# objdump -T /bin/zsh | grep -w zfree
0000000000446420 g    DF .text  0000000000000012  Base        zfree

0x46420 is the offset of zfree in object /bin/zsh that is loaded at
0x00400000. Hence the command to uprobe would be:

# echo 'p:zfree_entry /bin/zsh:0x46420 %ip %ax' > uprobe_events

And the same for the uretprobe would be:

# echo 'r:zfree_exit /bin/zsh:0x46420 %ip %ax' >> uprobe_events
How does DTrace works with USDT
From dtrace4linux doc
Add probe calls, via DTRACE_PROBE macros to the source code of the application. Compile code to object file (*.o) Use dtrace command line tool to convert the object file. This involves stubbing out the assembler function calls, and creating a table in the ELF file enumerating the probes. Create (link) the application binary, with a special object file (drti.o). drti.o runs before main() and takes the table of probes, and lets the kernel know (via an ioctl() to the dtrace driver) of the probes. Run the application: drti.o takes control and issues the ioctl() of the probes. Whilst the application is running, you can use "dtrace -l" to see the probes. Probes are a function of the pid provider, so you will see a new suite of probes for each process running with USDT, and as many probes as there are DTRACE_PROBE calls in the source code. Whilst the application is running, you can use dtrace to monitor these probes at any granularity you like (eg all probes from the process, or specific probes from all such processes). When a dtrace monitors the probe, the site where the call instruction is placed is modified and an INT3 (breakpoint instruction) is placed at the site of what was the original CALL instruction. When the breakpoint is hit, the dtrace driver takes control and actions the probe. This is very similar to how a kernel FBT probe works, except the breakpoint happened in user space. At the point of breakpoint execution, any D script associated with the probe is invoked. The target application is frozen until the D script completes, allowing it to take a static snapshot of any details it likes. Typically, this might include taking a user stack dump (ustack()). Terminating a dtrace which is probing the application will remove the breakpoints and restore the NOP instructions.
DTrace USDT sample running on Solaris(DTrace) and Linux(via Systemtap)
There is a sample(link) made by agentzh on this.
Steps:
git clone https://github.com/agentzh/usdt-sample
make
Run:

    Terminal 1:
        ./test

    Terminal 2:
        for dtrace:
            sudo ./run.d

        for systemtap:
            sudo ./run.stp
Compile executable with "–with-dtrace" option
E.g: compile node.js
configure –with-dtrace
readelf
vagrant@ubuntu-bionic:~/node$ readelf -n out/Release/node

Displaying notes found in: .note.ABI-tag
	Owner                 Data size       Description
GNU                  0x00000010       NT_GNU_ABI_TAG (ABI version tag)
	OS: Linux, ABI: 3.2.0

	Displaying notes found in: .note.gnu.build-id
	Owner                 Data size       Description
GNU                  0x00000014       NT_GNU_BUILD_ID (unique build ID bitstring)
	Build ID: b48d322dc7ed39c3bd817023186e22456d6cd468

	Displaying notes found in: .note.stapsdt
	Owner                 Data size       Description
stapsdt              0x0000003c       NT_STAPSDT (SystemTap probe descriptors)
	Provider: node
	Name: gc__start
	Location: 0x000000000073c3e4, Base: 0x0000000001e07840, Semaphore: 0x00000000022ca4dc
	Arguments: 4@%esi 4@%edx 8@%rdi
stapsdt              0x0000003b       NT_STAPSDT (SystemTap probe descriptors)
	Provider: node
	Name: gc__done
	Location: 0x000000000073c3f4, Base: 0x0000000001e07840, Semaphore: 0x00000000022ca4de
	Arguments: 4@%esi 4@%edx 8@%rdi
stapsdt              0x00000067       NT_STAPSDT (SystemTap probe descriptors)
	Provider: node
	Name: http__server__response
	Location: 0x000000000073c9c6, Base: 0x0000000001e07840, Semaphore: 0x00000000022ca4d6
	Arguments: 8@%rax 8@-1128(%rbp) -4@-1132(%rbp) -4@-1136(%rbp)
stapsdt              0x00000068       NT_STAPSDT (SystemTap probe descriptors)
	Provider: node
	Name: net__server__connection
	Location: 0x000000000073d096, Base: 0x0000000001e07840, Semaphore: 0x00000000022ca4d0
	Arguments: 8@%rax 8@-1128(%rbp) -4@-1132(%rbp) -4@-1136(%rbp)
stapsdt              0x00000061       NT_STAPSDT (SystemTap probe descriptors)
	Provider: node
	Name: net__stream__end
	Location: 0x000000000073d766, Base: 0x0000000001e07840, Semaphore: 0x00000000022ca4d2
	Arguments: 8@%rax 8@-1128(%rbp) -4@-1132(%rbp) -4@-1136(%rbp)
stapsdt              0x00000060       NT_STAPSDT (SystemTap probe descriptors)
	Provider: node
	Name: http__client__response
	Location: 0x000000000073de83, Base: 0x0000000001e07840, Semaphore: 0x00000000022ca4da
	Arguments: 8@%rdx 8@-1128(%rbp) -4@%eax -4@-1136(%rbp)
stapsdt              0x00000089       NT_STAPSDT (SystemTap probe descriptors)
	Provider: node
	Name: http__client__request
	Location: 0x000000000073e7b2, Base: 0x0000000001e07840, Semaphore: 0x00000000022ca4d8
	Arguments: 8@%rax 8@%rdx 8@-2184(%rbp) -4@-2188(%rbp) 8@-2232(%rbp) 8@-2240(%rbp) -4@-2192(%rbp)
stapsdt              0x00000089       NT_STAPSDT (SystemTap probe descriptors)
	Provider: node
	Name: http__server__request
	Location: 0x000000000073f323, Base: 0x0000000001e07840, Semaphore: 0x00000000022ca4d4
	Arguments: 8@%r13 8@%rax 8@-4392(%rbp) -4@-4396(%rbp) 8@-4352(%rbp) 8@-4360(%rbp) -4@-4400(%rbp)
compile without "–with-dtrace"
readelf
vagrant@ubuntu-bionic:~/node$ which node
/usr/local/bin/node
vagrant@ubuntu-bionic:~/node$ readelf -n `which node`

Displaying notes found in: .note.ABI-tag
	Owner                 Data size       Description
GNU                  0x00000010       NT_GNU_ABI_TAG (ABI version tag)
	OS: Linux, ABI: 3.2.0

	Displaying notes found in: .note.gnu.build-id
	Owner                 Data size       Description
GNU                  0x00000014       NT_GNU_BUILD_ID (unique build ID bitstring)
	Build ID: 01e04169abbfe5467e81d09cf895b9aaa9820732