CallTracer
Table of Contents
- Table of Contents
- CallTracer
- Features
- Prerequisites for run the example
- Example
- How to run
- Visualizer
- TODO
- Join us
CallTracer
CallTracer is an instrument toolkit and aimed to provide an easy way for native(C/C++) program debugging, in particular, it can work as an utility to record and layout the program execution details in various straight-forward representation ways.(e.g: sequencing diagram, flamegraph)
It is compiled as a shared-lib and linked into a C/C++ program to enable the tracer. So far, it provides an user-friendly integration features for the program which is built upon gyp or waf, and also provides an out-of-box utility tool to convert the call stack into file names and source code line, finally be converted and presented by an appropriate visualizer, including: seqdiag, diagrams and flamegraph(default).
Features
-
Executable ELF (non-pie)
-
Static library
-
Dynamic linking library
-
Dynamic loading library
-
Tracing forked process
-
Multiple threads
-
Flamegraph
-
Seqdiag
-
Diagrams
If you are familiar with
flamegraph, you might know about it originally is used for sampling data without an order guarantee. In calltracer, the generated flamegraph are for tracer data, and we will ensure the call stack sequencing following the tracer generated order.
Notable, turning on the func-trace will introduce significant performance impact, please avoid enabling it on a production environment.
Prerequisites for run the example
-
Linux OS (Tested on Ubuntu variants)
-
Have
addr2linecommand installed on your system -
Have
node.jsruntime on your environment -
(optional)
seqdiagcommand, only be required if you want to generate seqdiag style sequencing diagram
Example
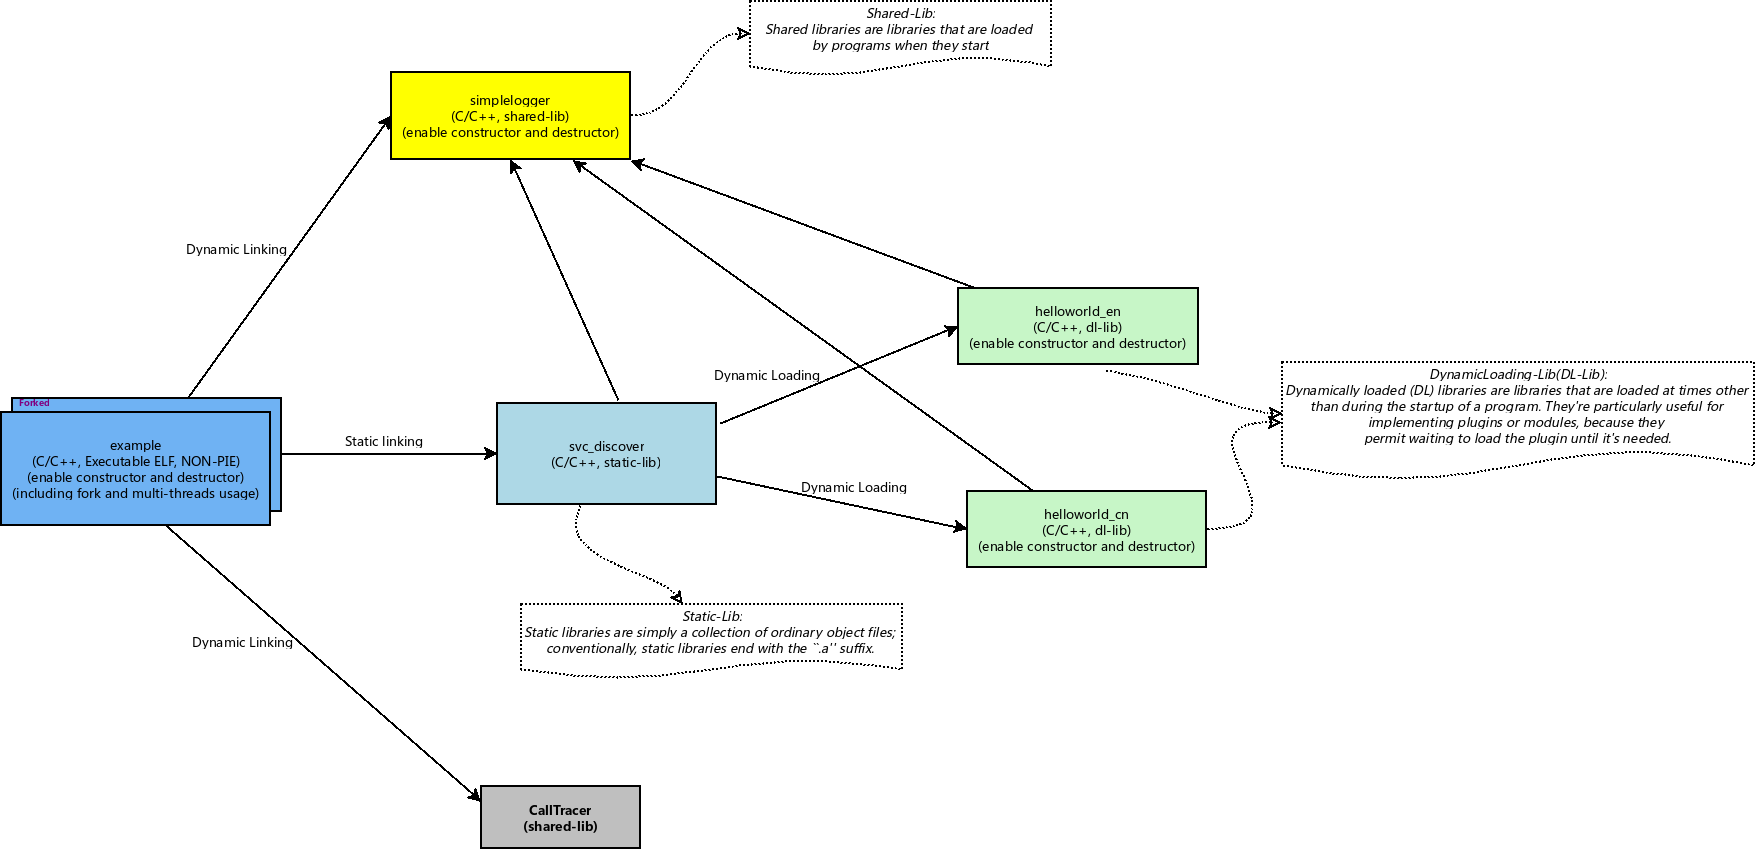
The sample is just used to demonstrate the usages of the tool. To make the sample cover mores situations, e.g: executable ELF, static-lib, dynamic linking shared-lib, dynamic loading shared-lib, forked process and multiple-threads, I am trying to split the sample into various modules with different lib types, this definitely does not make a sense in a real-life program.

How to run
The project is using GYP as the compile tool.
git clone https://github.com/leezhenghui/calltracer.git
git submodule update --init

make clean
make
make run-debug
Using below command to conver the trace log into a visualizer view:
  cd ./tools/iseq/
  npm install
  ./tools/iseq/iseq
Visualizer
FlameGraph (default)
Open the original image and click(zoon in) the flame block you are interested in and get more detailed invocation information followed by that point, e.g: invocation seq, invocation occurs timestamp, file name and source code line.
Seqdiag

Diagrams
TODO
-
Dynamic Tracer support, enable/disable the tracer on-the-fly
-
Support
dlclose -
Code refine/refactor
Join us
If you are interested in this project, please feel free to let me know, any bug-report/comments/suggestions/contribution on this project is appreciated. :-)

